London Ontario Real Estate. No Fluff. No Sales Pitch. Just the Truth.

 Written by Ty Lacroix — Real Estate Strategist & Broker, London Ontario 

RSS

What the Averages Aren't Telling You About London Ontario Real Estate

London, Ontario's June 2026 market is being reported as "slow" because averages are up only modestly — but averages hide a $200,000 to $500,000 spread within a single neighbourhood. Sellers who understand their specific pocket and price accordingly are moving. Buyers who are waiting for a signal that never comes are already behind. Broker Ty Lacroix breaks down what June actually shows across ten London neighbourhoods — and what it means before you decide anything.

Every week, someone reads a headline that says London home sales are up 2% — and concludes the market is slow. That's not analysis. That's a number without a neighbourhood.

Here's what actually matters: within a single London neighbourhood, there can be a $200,000 to $500,000 spread between one street and the next. A bungalow backing onto green space in Byron is not the same market as a comparable footprint two blocks inland. An executive townhome in Sunningdale is not the same market as a resale detached home in the three subdivisions over. Averaging them together and reporting the result as "the London market" tells you almost nothing useful.

The June 2026 numbers across London's established neighbourhoods tell a more honest story. More homes are on the market — sellers and their realtors know it, and the ones pricing to that reality are selling. Buyers who understand the same thing are acting on it. The ones sitting on the fence waiting for prices to drop further, or for some cleaner signal from the news, are making a decision by not making one — and they'll feel it.

This is what the market looks like right now in the ten neighbourhoods I track every month. Not the average. The actual picture, area by area.

See all ten London neighbourhood updates →

If you're a seller trying to understand what your specific home is worth in this market — not the average, your home — or a buyer trying to read where the real value is before someone else does, that's the conversation I have every day.

Would you like one?

Also find me at tylacroix.com and Totally Preachless

Read

How Long Does It Take to Sell a House in Wortley Village and Old South London, Ontario?

This is a historical snapshot — the real estate market in Old South London, including Wortley Village, Ontario, for mid-March 2026. Markets move month to month. For current stats and my honest read on where each part of the city is actually heading, see my London neighbourhood market updates — ten neighbourhoods, refreshed monthly. Or for what your specific home is worth in today's market, reach out for a personal analysis. No pressure, no pitch.

Selling a property in the Wortley Village and Old South area currently takes an average of 19 days, which is 32% faster than the broader London average of 28 days. The neighbourhood operates with a low 3.7 Months of Inventory, indicating a highly competitive environment for buyers and a distinct advantage for sellers. Partnering with a dedicated Real Estate Strategist ensures that this rapid market pace is leveraged to protect your equity and maximize the return on your historic architectural asset.

The Market Math Behind Old South’s 19-Day Sales Cycle

Transitioning your wealth out of a primary residence requires precision, not guesswork. In Old South London, the data reveal a highly insulated micro-economy driven by sustained demand for the walkable, historic lifestyle of Wortley Village. Currently, homes in this specific pocket are selling in just 19 days. Compared with the 28-day average for the rest of London, Old South properties clearly command immediate attention.

Supply, Demand, and Your Equity

This accelerated timeline is directly tied to scarcity. Old South is currently sitting at 3.7 Months of Inventory (MOI). In real estate economics, any metric below 4 months signals restricted supply and heightened competition among buyers. Furthermore, the Sales-to-New-Listings Ratio (SNLR) in Old South rests at 41.1%, compared to London’s broader 36.8%. This data confirms that buyers are actively absorbing new listings as soon as they hit the market, consistently pushing the Sales-to-List Price ratio to a strong 97.8%.

The Strategic Approach to Asset Transition

A 19-day average days-on-market does not guarantee an effortless transaction; it highlights the critical need for absolute pricing precision. When a neighbourhood's reputation drives emotional buyer behaviour, the greatest risk to your equity is a generalized marketing approach. Unique, older homes cannot be treated like modern subdivision builds.

Successfully navigating this rapid sales cycle requires a Realtor who understands the architectural nuances of your property and the financial weight of your transition. By aligning with a neighbourhood Realtor who tracks this hyper-local math, you ensure your property is positioned to capture peak emotional demand without leaving capital on the table.

See What Is For Sale Now in Old South London and the local trends.

Also find me at tylacroix.com and Totally Preachless

Read

Selling in London, Ontario: Use 'Market Math' to Discover What Today’s Selective Buyers Really Want.

What London's 2026 Buyers Are Really Looking For — And What It Means If You're Selling

London, Ontario's 2026 housing market has matured into a balanced-to-buyer's landscape with roughly five to six months of inventory — and today's buyers are more selective, more informed, and more patient than at any point in the past five years. They're auditing energy efficiency, income potential, and condition before they write an offer, and they're negotiating with discipline. In the South West premium corridors — Byron, Lambeth, and Riverbend — detached homes are anchoring around $836,709 with a 97.5% sale-to-list ratio and a 40-day median. Sellers who price accurately on day one are moving. Sellers who "test the market" are sitting. Ty Lacroix, Broker at The Envelope Real Estate Group, has spent 24 years helping London sellers understand the buyer before the sign goes up.

If you've been watching the London, Ontario real estate market lately, the shift is hard to miss. The frantic, sight-unseen era is behind us. In 2026, London has settled into a balanced-to-buyer's market where roughly five to six months of inventory means buyers aren't just looking for a house — they're looking for the right one, on their terms.

As a seller, understanding what's driving that buyer mindset is the difference between a sold sign and a listing that quietly expires. Here's what's actually shaping buyer behaviour right now, from Byron to Old North.

1. Today's Buyers Are Calculating, Not Panicking

With interest rates stabilizing, buyers in London's upper brackets aren't rushing. They're running numbers. Long-term value and monthly carrying costs are the lens — not urgency, not fear of missing out.

In 2026, the features buyers are prioritizing have shifted in ways that matter for how you present your home:

Energy efficiency. High-efficiency HVAC systems and smart thermostats aren't extras anymore. They're shields against rising utility costs, and buyers are specifically asking about them.

Income potential. With the average detached home priced near $679,000, buyers are actively looking for mortgage helpers — finished basements, secondary suites, or properties with potential for an accessory dwelling unit. A home that can offset carrying costs is a more defensible purchase in this market.

Dedicated workspace. Remote and hybrid work has moved past "a desk in the corner." Buyers want a proper, sound-insulated office space with reliable connectivity. Homes that can deliver it are differentiating themselves from those that can't.

2. Condition Is the Deciding Variable

In a market where buyers have choices — and right now they do — condition is the ultimate lever. We are seeing a clear quality gap in 2026.

Move-in-ready homes — updated kitchens, neutral, modern finishes, well-maintained systems, and genuinely liveable staging — are still drawing serious interest. Homes that need work but are priced as though they don't are sitting for 40-plus days and accumulating the stale-listing stigma that disciplined buyers spot immediately.

This is the market's bluntest message to sellers right now: buyers will wait for the right home. They are not going to pay a move-in-ready price for a project, regardless of how good the bones are.

3. Where the Demand Is — and Where It Isn't

London's neighbourhoods are behaving differently, and understanding which micro-market you're in matters more than the city-wide average.

North and West London — Byron, Oakridge, Sunningdale — remain the forever-home corridors. Buyers here are prioritizing school catchments, trail access, and long-term stability. These are not speculative purchases; they're considered, well-researched decisions by buyers who know exactly what they want and what they'll pay for it.

East and South London — demand is driven by commuters and value-oriented buyers looking for proximity to the 401 and employment corridors. Different buyer, different calculus, different pricing reality.

The Numbers That Actually Matter in the South West

If you're selling a detached home in Byron, Lambeth, or Riverbend, city-wide averages will mislead you. Here's what the data actually shows for the South West premium corridor right now:

$836,709 is the current median price for a detached home in these neighbourhoods. This is the number buyers are using to judge value. If your home is priced above it without the features today's buyers are specifically looking for — dedicated office space, energy efficiency, secondary suite potential — you are pricing against the current flow, not with it.

The sale-to-list ratio is 97.5% in these high-demand areas. Even London's most desirable corridors are seeing buyers negotiate — typically around 2.5% off the asking price. Accuracy on day one is your primary defence against a stagnant listing. Overpricing by even a small margin signals to a disciplined buyer that you're not serious, and they move on.

40 days is the current median time on market for detached homes in the South West. The data shows a critical threshold around day 21: if you don't have genuine traction — showings, feedback, offers — by then, the strategy needs a pivot before the listing goes stale. Stale listings in this market attract low offers or no offers.

What This Means Before You List

The "test the market" pricing strategy was effectively finished in 2026. Accuracy beats optimism, every time. Buyers in Byron and Riverbend are looking for transparency, honest pricing, and homes that show evidence of care — not a number anchored to 2022 and a hope that someone will meet you there.

The market isn't harder than it was. It's just smarter. And the sellers who understand the buyer before the sign goes up are the ones walking away with the result they wanted.

If you're considering selling in London's South West this year and want a straight, data-backed read on where your home stands before you commit to a price, that's the conversation to have first.


Know what your buyer is thinking before they walk through the door. Reach out for a private conversation — no pressure, no pitch.

For the complete selling framework: Selling Your Home in London, Ontario →

Also find me at tylacroix.com and Totally Preachless

Read

The 2026 Riverbend London Real Estate Report: Why Data-Driven Buyers & Sellers Are Winning

This is a historical snapshot — the Riverbend, London, Ontario real estate market in 2025. Markets move month to month. For current stats and my honest read on where each part of the city is actually heading, see my London neighbourhood market updates — ten neighbourhoods, refreshed monthly. Or for what your specific home is worth in today's market, reach out for a personal analysis. No pressure, no pitch.

What makes Riverbend sought-after in 2026? Riverbend has evolved into a high-functioning ecosystem. It is no longer just a suburb; it is a destination where professionals live within minutes of their clinics and offices. The strategic combination of West 5 commercial convenience and the privacy of the RiverBend Golf Community makes this pocket resilient against broader market fluctuations.

The "Riverbend Advantage": Data You Can't Get Elsewhere

When you browse Riverbend homes on our site, you get access to the "insider track" that no other London Realtor provides. We believe in total transparency, which is why we offer:

  • Full Property Details & Photos: Beyond the basic MLS® summary.

  • Hyper-Local Context: Integrated maps showing exact proximity to Kains Woods and West 5 services.

  • Real-Time Market Stats: View the average list vs. sold prices and current days on market specifically for Riverbend—not just general London averages.

  • Lifestyle Intelligence: Walk scores, transit data, and detailed school catchment boundaries.

2026 Market Conditions: By the Numbers. The current market in Riverbend remains a Buyer’s Market, with a sales-to-new-listings ratio of 72% as of late 2025.

  • Detached Homes: Averaging approximately $765,000, though custom builds in private enclaves often exceed $1.8M.

  • Condos & Townhomes: Benchmark prices range from $524k to $635k, offering a strategic entry point for those prioritizing the West 5 lifestyle.

  • Sold Data: In recent months, Riverbend homes have sold for an average of 96.4% of the asking price, with a median time on market of 43 days.

SEE ALL THE HOMES FOR SALE IN RIVERBEND, LONDON NOW.

Also find me at tylacroix.com and Totally Preachless

Read

Oakridge, London, Ontario, Real Estate Homes and Condos

This is a historical snapshot — the Oakridge, London, Ontario market in 2025. Markets move month to month. For current stats and my honest read on where each part of the city is actually heading, see my London neighbourhood market updates — ten neighbourhoods, refreshed monthly. Or for what your specific home is worth in today's market, reach out for a personal analysis. No pressure, no pitch.

Oakridge is a tapestry of micro-markets. Understanding the nuances between Oakridge Acres (ideal for traditionalists) and Oakridge Meadows (perfect for new-build seekers) is essential for a successful transaction. Whether you are eyeing the park-side serenity of Hazelden Park or the river-access of Riverside Gardens, each street offers a different value proposition in 2026.

What makes Oakridge so sought-after in 2026?

The enduring appeal of Oakridge lies in its recreational infrastructure. Having the Thames Valley Golf Course and its 18-hole and 9-hole Hickory courses within walking distance adds a layer of lifestyle luxury that few other London neighbourhoods can match. This, combined with the "walkable" feel of the Hazelden North area, keeps demand high even when inventory fluctuates.

What are the current Oakridge market conditions?

In the current 2026 landscape, we are navigating a Buyer’s Market with roughly 5 months of inventory. This is a significant shift for Oakridge, which historically sees very low turnover.

  • For Sellers (60% Focus): Standing out in Oakridge Gardens or Oakridge Park requires more than a lawn sign. We utilize "Entity-Based SEO" to ensure your home appears when buyers search for specific sub-neighbourhoods.

  • For Buyers (40% Focus): You currently have the most choice in a decade. It is prime time to secure a "forever home" in Riverside Gardens, with terms that protect your investment.

The Oakridge "Pros" List:

  • Proximity to Nature: The Thames Valley Parkway and Sifton Bog.

  • Premier Golfing: Minutes from the historic Thames Valley Golf Course.

  • Diverse Housing: From the mid-century gems in Oakridge Acres to modern executive homes in Hazelden North.

  • Elite Education: Home to some of the city's highest-ranking elementary and secondary schools.

Would you like to view all the houses, townhouses, townhomes, and apartment condos for sale in the Oakridge neighbourhood of London, Ontario?

Not only will you be able to see what is listed for sale, but you can also see:

  • Full details of each property

  • Photos

  • Maps

  • Schools

  • Parks and Recreation

  • Transit

  • The neighbourhood statistics

  • The days on the market

  • The average list prices and sold prices

SEE ALL THE HOMES FOR SALE IN OAKRIDGE, LONDON NOW.

Also find me at tylacroix.com and Totally Preachless

Read

Old South London & Wortley Village Real Estate: A Market Guide

This is a historical snapshot — the Old South, Wortley Village, London, Ontario real estate market in 2025. Markets move month to month. For current stats and my honest read on where each part of the city is actually heading, see my London neighbourhood market updates — ten neighbourhoods, refreshed monthly. Or for what your specific home is worth in today's market, reach out for a personal analysis. No pressure, no pitch.

Wortley Village is the historic core of Old South London, but the community’s reach extends far beyond the village shops. Old South offers a diverse range of properties, from original yellow-brick cottages near the village centre to high-end estates on expansive lots. For those selling in 2026, understanding this nuance is the key to a successful transaction.

Is now the right time to sell in Old South?

With approximately 5 months of inventory currently on the market, Old South has shifted into a Buyer’s Market. For homeowners, this means your property is competing with more listings than we have seen in recent years. Success in this environment requires an elite digital strategy and precise pricing to ensure your home stands out to the most qualified buyers.

Despite the increase in supply, Old South remains one of London’s most resilient markets. The combination of architectural heritage, mature tree canopies, and a strong sense of community continues to attract serious interest. We focus on highlighting the "lifestyle ROI" of your home—emphasizing its history and its proximity to the village—to justify your valuation even in a crowded market.

What makes Old South a top choice for buyers in 2026?

For buyers, the current market provides a rare opportunity to be selective. You can explore a wide variety of housing styles, from mid-century modern designs to meticulously maintained heritage homes. The increased inventory means you have the time to find a property that truly aligns with your long-term goals without the pressure of immediate bidding wars.

2026 Old South Market Snapshot

  • Market Status: Buyer’s Market

  • Inventory Levels: 5.2 Months of Supply

  • Average Listing Duration: 38 to 45 Days

  • Sales-to-List Price: Approximately 96.5%

  • Property Variety: High (Detached, Townhomes, Heritage Condos)

Discover Old South London and Wortley Village

Uncover the charm of this sought-after neighbourhood and find the perfect place to call home. Whether you are looking to sell at the best possible price or buy into this historic community, our platform is your primary resource.

You can instantly view all houses, townhouses, townhomes, and apartment condos for sale, updated six times daily!

Plus Get:

  • Full details of each property and its unique history.

  • High-resolution photos and interactive area maps.

  • Direct information on schools and local parks.

  • Detailed info on transit and recreation, including Thames Park.

  • The latest neighbourhood statistics and inventory data.

  • Current days on the market and average list-to-sold price ratios.

[SEE ALL THE HOMES FOR SALE IN OLD SOUTH LONDON / WORTLEY VILLAGE NOW]

Also find me at tylacroix.com and Totally Preachless

Read

Byron London Ontario Real Estate: Luxury Homes & Comfortable Safe Living

This is a historical snapshot — the Byron, London, Ontario real estate market in 2025. Markets move month to month. For current stats and my honest read on where each part of the city is actually heading, see my London neighbourhood market updates — ten neighbourhoods, refreshed monthly. Or for what your specific home is worth in today's market, reach out for a personal analysis. No pressure, no pitch.

What makes Byron a stable choice for 2026? As we move into 2026, Byron has emerged as a "Blue Chip" neighbourhood, offering a rare sense of market stability. While other regions may experience volatility, Byron's limited geographic boundaries—nestled between the Thames River and Boler Mountain—ensure that supply remains naturally constrained. This inherent scarcity makes it a safe haven for homeowners' equity while maintaining its status as a high-demand destination for those relocating to London.

How do 2026 market conditions create a "Fair Play" environment? The current market is defined by ~5 months of inventory, officially placing us in a Buyer's Market for the first time in years.

However, this isn't a "crash"; it is a stabilization. For buyers, this means the ability to include home inspections and financing conditions without the pressure of a bidding war.

For sellers, it means that while your home may stay on the market longer (averaging 35–45 days), the buyers coming through your door are highly qualified, serious, and ready to pay a fair price for the premium Byron lifestyle.

What should buyers and sellers expect this year? The 2026 "Byron Opportunity" looks different depending on your goals:

  • For Buyers: You finally have the leverage to be picky. You can prioritize specific school catchments or wait for a home with that exact "Old Byron" backyard you've always wanted.

  • For Sellers: Presentation is now the primary driver of value. In a market with more choice, homes that are marketed correctly and priced with 2026 data—not 2022 expectations—are the ones that stand out and sell.

  • For Everyone: The "Byron Premium" remains intact. Whether buying or selling, you are participating in a micro-market that values community, nature, and long-term livability over short-term speculation.

SEE ALL THE HOMES FOR SALE IN BYRON, LONDON NOW!

Also find me at tylacroix.com and Totally Preachless

Read

Lambeth Luxury & Lifestyle: Why This Southwest London Gem is 2026’s Top Choice

This is a historical snapshot — the Lambeth, London, Ontario real estate market in 2025. Markets move month to month. For current stats and my honest read on where each part of the city is actually heading, see my London neighbourhood market updates — ten neighbourhoods, refreshed monthly. Or for what your specific home is worth in today's market, reach out for a personal analysis. No pressure, no pitch.

The real estate landscape in London, Ontario, has shifted toward a more balanced, "normalized" environment. For those seeking an elevated quality of life without sacrificing city convenience, one neighbourhood consistently stands out: Lambeth. This picturesque community in southwest London has mastered the art of growing in a "measured, practical way," offering a rare mix of historical charm and modern luxury.

The Charm of Mature Lambeth

The original heart of Lambeth is defined by its "small-town feel," a legacy from its days as an independent village. Here, you will find quiet, tree-lined streets with homes that have been part of the community for decades. These established areas are prized for their mature trees and larger lot sizes, offering a level of privacy and "settled" character that is hard to replicate in newer developments.

Prestigious Enclaves: The New Standard of Luxury

For the modern buyer, Lambeth has seen substantial growth in high-end, residential developments that redefine suburban luxury.

  • Heathwoods: Often considered the flagship of Lambeth’s new growth, this "lush green neighbourhood" features large lots and custom-built estates by premier builders like Bridlewood and Royal Oak.

  • Privé: An ultra-exclusive enclave of just 30 French-inspired luxury residences, Privé offers a secluded, high-design retreat for those seeking the pinnacle of updated architecture.

  • Liberty Crossing: Known for its contemporary layouts and vibrant streetscapes, this area appeals to buyers looking for modern, low-maintenance living with a "vibrant" feel.

A Lifestyle Built Around Livability

Lambeth suits those who want a "balanced lifestyle"—not entirely rural, yet far enough from the city's bustle to feel separate. Families are drawn to top-tier local institutions like Lambeth Public School, while the Lambeth Community Centre serves as a vital hub with its arena, gymnasium, and library. For recreation, residents enjoy Lambeth Centennial Park, which features soccer fields, a spray pad, and scenic walking trails that connect the community to nature.

Commuting is equally straightforward. Located at the "landing place" near the intersection of Highways 401 and 402, Lambeth offers effortless access for those travelling into the city core or out toward the rest of Ontario.

The 2026 Market Opportunity

With approximately 5.4 months of inventory currently on the market in London, we are firmly in a "Buyer’s Market". This inventory peak—the highest in three years—means buyers in Lambeth have more choice and better negotiating power than they’ve had in nearly a decade. Whether you are looking for a "forever home" in a mature pocket or a custom-built masterpiece in a new enclave, Lambeth offers a stable, high-demand community that remains "stable yet not stagnant".

See All The Homes For Sale In Lambeth, London, Ontario, Now!

Also find me at tylacroix.com and Totally Preachless

Read

Byron London, Ontario Real Estate Market

This is a historical snapshot — the Byron, London, Ontario market in 2024 and previous years. Markets move month to month. For current stats and my honest read on where each part of the city is actually heading, see my London neighbourhood market updates — ten neighbourhoods, refreshed monthly. Or for what your specific home is worth in today's market, reach out for a personal analysis. No pressure, no pitch.

Here is what is for sale now on MLS in Byron, London, Ontario

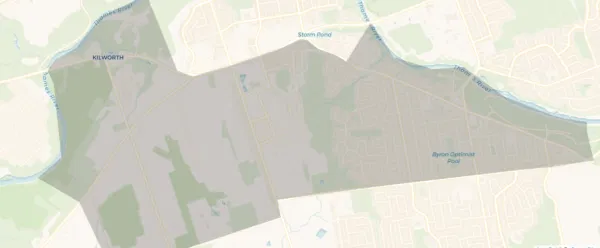
ne section of Byron London, in our MLS system, stated as South B.

The above is one section of Byron, London, in our MLS system, stated as South B.

South B and South K cover the Byron neighbourhood. The commercial heart of the neighbourhood is at Commissioners and Boler, featuring a commercial corridor and a grocery-store-anchored shopping plaza.

The Byron core has:

  • a library,

  • a fire hall,

  • a legion,

  • a Masonic hall,

  • restaurants and dining,

  • professional offices,

  • medical and drugstores,

  • an LCBO,

  • jewellers, dry cleaners, and a few eclectic retailers.

Here is a link to Byron South B, including demographics, household types, schools, recreation, and much more you may want to know about a neighbourhood.

There is another commercial area at the intersection of Boler and Byron Baseline.

Byron South K

This part of Byron (South K) primarily consists of detached homes. Its population has remained stable, with 26% of households moving in the past 5 years and 8% in the past year. The area is mainly owner-occupied and has a mix of older and newer homes.

People & Families in South K

 Boler Mountain is a ski and mountain-biking area known locally as “the bump.” 

Experience the area’s natural beauty with various walking and biking trails. Springbank Park spans 300 acres along a stretch of the Thames River and features 19-plus miles of trails. Nearby are Komoka Provincial Park and the Warbler Woods Trail. 

Below covers the historical Byron, London, Ontario, real estate market conditions for the years listed. For current market insights, updated stats, or expert guidance, contact me for a personalized analysis.


As of April 4, 2025, 55 houses had sold in Byron London, averaging 39 days on the market. Four apartment condos sold, averaging 76 days on the market; five townhouses and townhomes sold, averaging 17 days on the market.

The 2024 Byron London Ontario Real Estate Market

Houses Sold in 2024 185Apartment Condos Sold in 2024  21Townhouses/Townhomes Sold in 2024  47
Time on Market 28 days Time on Market  42 daysTime on Market 40 days
Price Range $399,900 – $2,125,000Price Range $350,000 -$887,500Price Range $379,500 – $925,000
% to Asking Price 99.36%% to Asking Price 98.05%% to Asking Price 97.86%

Byron London Ontario Real Estate Market Data from MLS London St.Thomas Association of Realtors (LSTAR)

Previous Years Byron London Ontario Real Estate Market Sold Prices

Sold is a great four-letter word for Byron London, Ontario Home Sellers

Houses Sold Year in 2023 184Apartment Condos Sold in 2023 23Townhouses/Townhomes Sold in 2023   62
Time on Market 24 daysTime on Market 26 daysTime on Market 21 days
Price Range $520,000 – $2,215,000Price Range $300,000 -$982,500Price Range $390,000 – $900,000
% to Asking Price 98.52%% to Asking Price 97.38%% to Asking Price 99.14%

Byron London Ontario Real Estate Market Data from MLS London St.Thomas Association of Realtors (LSTAR)

2022

  • In 2022, 180 houses in Byron, London were sold through MLS. The average number of days they were on the market before selling was 16, up 8 days from Spring 2022. These 180 houses in Byron sold for 109.25% of the asking price, ranging from $490,000 to $3,450,000. Eighteen apartment condos were sold, and the average days on the market were eleven. The average sold price was 108.98% of the asking price, with prices ranging from $299,000 to $1,211,000. Forty-five townhouses or townhomes sold within 15 days on the market. Sold prices ranged from $439,000 to $980,000, with an average of 110.15% of the asking price.

2021

  •   In 2021207 houses in Byron, London, Ontario, were sold through MLS. They averaged 12 days on the market and sold for 112.93% of the asking price. The low was $480,000, and the highest was $2,125,000! Twenty-two apartment condos in Byron exchanged hands, averaging 26 days on the market. These sold for 100.77% of the asking price. The low was $375,000, and the high was $835,000. The median price per square foot was $408.00. Sixty-three townhouse condos & townhomes sold through MLS, averaging eight days on the market. These sold for 113.23% of the asking price—the low was $341,000, and the high was $811,000.

2020

  • In 2020,  322 Byron houses and condos were sold through MLS. 239 houses sold, with the median days on the market being eight and selling at 103.69% of the asking price. Sold prices ranged from $380,000 to $1,650,000. Eighty-three condominiums sold in Byron, ranging from $225,000 to $930,000. These were on the market for 12 days, and the median price was 101.7% of the asking price!

2019

  • In 2019, 234 houses in Byron, London, Ontario, sold between $270,000 and $1.094,000. The median days on the market were 12, and the sold prices were 100% of the asking price! For townhouses, townhomes, and apartments in Byron, 77 sold from a low of $177,500 up to $640,000. The median selling price for condos in Byron was 102.35% of the asking price. These condos averaged 9 days to sell.

2018

  •   In 2018, 215 houses sold in Byron, London, Ontario, for an average of $381,454- $103.22% of the asking price! These Byron houses took an average of 22 days to change hands. 61 Condominiums, including apartment condominiums, townhouses, and townhomes, sold for 105.46% of the asking price. The days to sell through MLS were 16, for an average selling price of $338,839!

  The Optimist Club of Byron is an excellent example of community volunteers.

Testimonial About What Our Clients Say About Envelope Real Estate Group

Disclosure:

  • I am a Broker Realtor in London, Ontario

  • While stats are valuable, you would be wise not to base any financial decision on them alone. What sold yesterday or six months ago on your street or in your community is history and cannot be changed. The buyer's or seller's motivation two months ago or three years ago to make a decision, we cannot change.

Also find me at tylacroix.com and Totally Preachless

Read

Riverbend London, Ontario Real Estate

This is a historical snapshot — the Riverbend market in London, Ontario, in 2024 and previous years. Markets move month to month. For current stats and my honest read on where each part of the city is actually heading, see my London neighbourhood market updates — ten neighbourhoods, refreshed monthly. Or for what your specific home is worth in today's market, reach out for a personal analysis. No pressure, no pitch.

The Riverbend real estate market in London, Ontario, has changed considerably over the last few years, with many options. The availability of apartment buildings, townhouses, and single-family homes has increased, as has the availability of the West 5 development.

Riverbend, London, Ontario, is a neighbourhood in the southwest part of London; take Oxford Street West to Kains Road. The rapid growth of retail, services, and offices along Oxford West provides nearby residents with essential amenities.

The gated Riverbend Golf Community is attractive and offers its members security, clubhouse facilities and dining. The Riverbend area is within 11 minutes of downtown London. There are great nature trails, bike paths, golfing, or simply doing nothing; you will enjoy the quiet. Five golf courses are within 4 km.

The walking trail along the Thames River (Kains Woods -Upper Thames River Conservation) is a gem for nature lovers. Nearby are the Warbler Woods Conservation Area and Komoka Provincial Park.

Here is What Is For Sale in The Riverbend Area Now on MLS

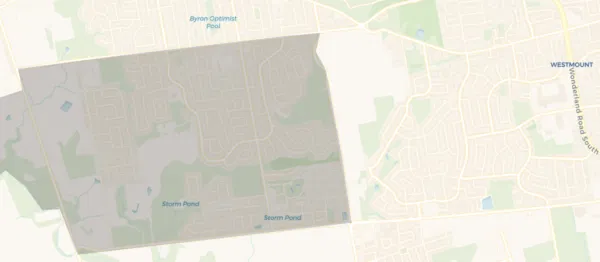
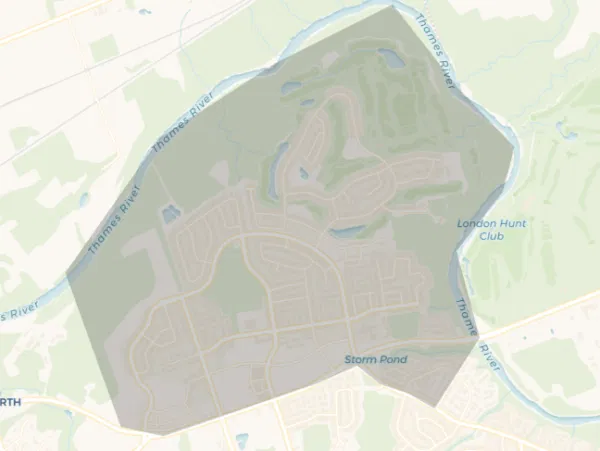
Riverbend map used by MLS

Our London, Ontario St. Thomas Real Estate Association (LSTAR) uses the above-shaded area, which is mapped as South A.

Homes Sold in The Riverbend, London, Ontario Area in 2024

Houses Sold in 2024 42Townhouses/Townhomes Sold Year to Date in 2024 12
Time on Market 65 daysTime on Market 36 days
Price Range $650,000 – $1,730,000Price Range $657,500 -$815,000
% to Asking Price 98.44%% to Asking Price 98.20%

Riverbend, London, Ontario, Real Estate Market Area Data as per MLS London St.Thomas Association of Realtors (LSTAR)

Previous Years’ Sales in The Riverbend London Area

Below are the historical real estate market conditions for London, Ontario, for the listed years for Riverbend London. For current market insights, updated stats, or expert guidance, contact me for a personalized analysis.

Houses Sold in 2023 51Townhouses/Townhomes Sold Year in 2023 39
Time on Market 36 daysTime on Market 26 days
Price Range $701,000 – $2,025,000Price Range $510,000 – $910,000
% to Asking Price 97.13%% to Asking Price 99.10%

Riverbend, London, Ontario, Real Estate Market Area Data as per MLS London St.Thomas Association of Realtors (LSTAR)

2022

In 202255 houses in Riverbend London sold with prices ranging from $740,000 to $1,695,000. This was 101.16% of the asking price, and these took an average of 23 days to sell. Five apartment-condos at 2050 Linkway were sold through the MLS. Averaging $512.00 per square foot, with prices ranging from $806,000 to $907,000. Thirty townhouses & townhomes in Riverbend London sold with prices ranging from $635,000 to $1,075,000. This was 109.26% of the asking price, and these 30 averaged 23 days on the market before selling.

2021

In 2021, 58 houses were sold in the Riverbend neighbourhood of London. Averaging 23 days to sell for 107% of the asking price. The final sale prices ranged from $675,000 to $1,790,000. Twenty-eight townhomes sold for 113.17% of the asking price. These took an average of nine days to sell and sold for prices ranging from $565,000 to $820,000. Eleven apartment condos sold at 2050 Linkway, averaging $453.00 per square foot, with prices ranging from $594,000 to $881,000.

2020

In 2020, 65 houses in the Riverbend neighbourhood of West London sold through the MLS at 99.92% of the asking price. The lowest is $503,000, and the highest is $2,650,000. For townhouses & townhomes in Riverbend, 22 changed hands, ranging from $449,900 to $520,532. This was 100.07% of the asking price and averaged 15 days on the market.

2019

 In 2019, our MLS system sold 77 homes in the Riverbend London neighbourhood. Prices ranged from $399,000 to $ 1,070,000, and listings averaged 34 days on the market. The median selling price was 99.91% of the asking price.

2018

  In 2018, 82 homes were sold through our local MLS in the Riverbend neighbourhood in London, Ontario. The average selling price was $681,665. This was 99.62% of the asking price. The median number of days to sell was 40. The lowest price was $366,697, and the highest was $1,500,000.

Why Children Like The Gated Riverbend Golf Community in London, Ontario

We always used to spend the holidays with Grandma and Grandpa.   They used to live in a big brick house, but Grandpa got retarded, and they moved to the Riverbend Golf Community, where everyone lives in beautiful little homes, so they don’t have to mow the grass anymore!

They ride around on their bicycles and scooters and wear name tags because they don’t know who they are anymore. They go to a wreck centre building, but they must have fixed it because it is okay now.

They do exercises there, but they don’t do them very well.   There is a swimming pool, but they all jump up and down in it with hats. At their gate, there is a dollhouse with a little old man sitting in it.

He watches all day so nobody can escape. Sometimes they sneak out and go cruising in their golf carts!

Nobody there cooks; they eat out. And, they eat the same thing every night — early birds.

Some of the people can’t get out past the man in the dollhouse. The ones who do get out bring food back to the wrecked centre for a potluck.

My Grandma says that Grandpa worked all his life to earn his retardment and thinks I should work hard so I can be retarded someday too.

When I earn my retardment, I want to be the man in the dollhouse. Then I will let people out, so they can visit their grandchildren.

Want to know what is for sale now on MLS in Riverbend, London?

Also find me at tylacroix.com and Totally Preachless

Read

Hyde Park London Ontario Real Estate

This is a historical snapshot — the Hyde Park, London, Ontario market in 2024 and previous years. Markets move month to month. For current stats and my honest read on where each part of the city is actually heading, see my London neighbourhood market updates — ten neighbourhoods, refreshed monthly. Or for what your specific home is worth in today's market, reach out for a personal analysis. No pressure, no pitch.

Here is what is for sale now in Hyde Park on MLS

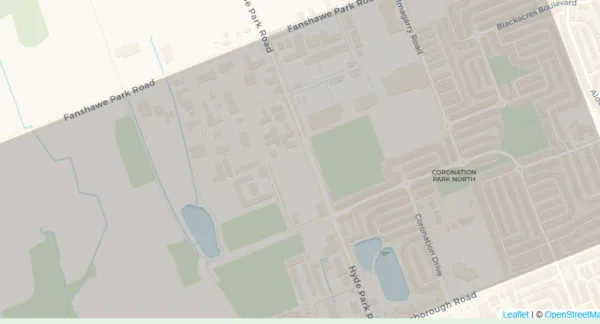
Hyde Park borders Fanshawe Park Road West to the north and east of Wonderland Road North and extends to the southwest corner of Oxford Road W.

A map of Hyde Park London Ontario Used by The MLS systems

Our London Ontario St.Thomas Real Estate Association (LSTAR) uses the above-shaded area, which is mapped as North E. 

A map of Hyde Park London Ontario Used by The MLS systems

North F Boundaries

This article covers the historical real estate market conditions in Hyde Park, London, Ontario, for the listed years. For current market insights, updated stats, or expert guidance, contact me for a personalized analysis.

The Hyde Park, London, Ontario Real Estate Market Area in 2024

Houses Sold Year-To-Date 207Apartment Condos Sold Year-To-Date 8Townhouses/Townhomes Sold Year-To-Date 59
Time on Market 31 daysTime on Market 39 DaysTime on Market  31 days
Price Range $440,000 – $930,000Price Range $350,000 -$535,000Price Range $380,000 -$678,378
% to Asking Price 99.03%% to Asking Price 99.77%% to Asking Price 99.86%

Hyde Park, London Real Estate Market As Per MLS Data, London St. Thomas Association of Realtors (LSTAR)

Prior Year Stats For The Real Estate Market in The Hyde Park, London Area.

Houses Sold Year in 2023 132Apartment Condos Sold in 2023  21Townhouses/Townhomes Sold in 2023 64
Time on Market 26 daysTime on Market 49 daysTime on Market 28 days
Price Range $453,500 – $1,260,000Price Range $305,000 – $523,000Price Range $360,000 – $695,000
% to Asking Price 98.95%% to Asking Price 96.62%% to Asking Price 98.07%

Hyde Park London Real Estate Market As Per MLS Data London St. Thomas Association of Realtors (LSTAR)

2022

  • In 2022186 houses in Hyde Park, London, were sold at prices ranging from $400,000 to $1,400,000. These were on the market for an average of sixteen days! These houses sold for an average of 106.94% of the asking price. Eighty-three townhouse condos in Hyde Park sold, ranging from $349,000 to $875,000. These were on the market for an average of fifteen days and sold for 111.22% of the asking price. Thirteen apartment condos sold, ranging from $439,000 to $625,000. This was 106.54% of the asking price, and the days on the market averaged 17.

2021

  •  In 2021267 houses in Hyde Park, London, sold through MLS, averaging nine days on the market. They sold for 111.34% of the asking price, with the lowest at $435,000 and the highest at $1,270,000. Nine apartment condos at 1030 Coronation Drive in the Hyde Park neighbourhood of London sold. 110 townhouse condos and townhomes in Hyde Park sold, averaging 7 days on the market. These sold for 109.11% of the asking price, ranging from $385,000 to $780,000.

2020

  • In 2020, 251 houses in Hyde Park were sold through our MLS system. The lowest price was $285,000, the highest $1,200,000, and they sold on average in nine days. These sold for a median of 101.89% of the asking price! 102 condos and townhouses in Hyde Park sold for prices ranging from $250,000 to $527,000. These took 11 days to sell for 100.71% of the asking price.

2019

  • In 2019, 281 houses in Hyde Park were sold through MLS, ranging from $238,000 to $825,00000. On average, a house in Hyde Park took 30 days to sell for 101.65% of the asking price. 106 townhouses and apartment condos were sold. Prices ranged from $235,500 to $630,000, with 101% of the asking price.

2018

  •  In 2018, 245 houses in Hyde Park sold for a median price of 102.19% of the asking price. These took about 22 days to change hands, with an average price of $429,302. In Hyde Park, 98 condominiums, including apartment-style and townhouses, sold. The median sold price was $299,553, 101.54%  of the asking price, and it took about 25 days to trade.

The Hyde Park Business Improvement Association, the Hyde Park Rotary Club, and other groups do an excellent job organizing events and activities.

Want to know what is for sale now in Hyde Park, London, Ontario, on MLS?

Also find me at tylacroix.com and Totally Preachless

Read

Old South London Ontario Real Estate

This is a historical snapshot — The Old South London Wortley Village market in 2024 and previous years. Markets move month to month. For current stats and my honest read on where each part of the city is actually heading, see my London neighbourhood market updates — ten neighbourhoods, refreshed monthly. Or for what your specific home is worth in today's market, reach out for a personal analysis. No pressure, no pitch.

Why Old South London and Wortley Village?

The character and charm of this great London neighbourhood is quite evident. Residents of Old South love the ability to walk and shop in the Wortley Village core—no wonder, with tree-lined streets and very few cookie-cutter homes.

There are more than 80 small businesses and establishments in Wortley Village, along with the Library and the YMCA.

Wortley Village BIA

The Old South Wortley Village Business Association does an excellent job hosting and presenting community events.

Here is what is for sale in Old South London on MLS

London South G map boundaries

Our London, Ontario, St. Thomas Real Estate Association (LSTAR) uses the shaded area shown above, mapped as South F.

London South F map boundaries

This article covers historical real estate market conditions in Old South London and Wortley Village, London, Ontario, for the listed years. For current market insights, updated stats, or expert guidance, contact me for a personalized analysis.

What Sold in 2024 in Old South London & Wortley Village

Houses Sold in 2024, 158Apartment Condos Sold in2024, 4Townhouses/Townhomes Sold in 2024 2
Time on Market 27 daysTime on Market 15 daysTime on Market 33 days
Price Range $260,000 – $1,500,000Price Range $477,000 -$1.070,,000Price Range $575,000-$750,000
% to Asking Price 99%% to Asking Price 101%% to Asking Price 100%

Old South London Area Data from MLS London St. Thomas Association of Realtors (LSTAR)

2023 Old South London Real Estate Market

Houses Sold in 2023 150Apartment Condos Sold in 2023 5Townhouses/Townhomes Sold Year To Date 0
Time on Market 21 daysTime on Market 33 daysTime on Market N/A
Price Range $302,500 – $1,600,000Price Range $255,000 – $549,900Price Range N/A
% to Asking Price 100.78%% to Asking Price 99.47%% to Asking Price N/A

Old South London, Ontario Real Estate Data provided by MLS London St.Thomas Association of Realtors (LSTAR)

2022

  • In 2022, 168 houses in Old South London were sold, with an average time to sell of 15 days. They sold for an average of 110.94% of the asking price, with prices ranging from $359,900 to $2,100,000. Nine apartment condos sold, and the average days on the market to sell through MLS was 23. The sold prices averaged 110.94% of the asking price, ranging from $500,000 to $1,200,000. Two townhouses sold, one at 30 Grand for $540,000 and one at 352 Ridout for $800,000.

2021

  • In 2021, 242 houses in Old South London, including Wortley Village, sold through MLS, averaging twelve days on the market. They sold for 111.03% of the asking price, with the lowest at $285,000 and the highest at $2,050,000. Thirteen apartment condos sold in Wortley Village in Old South London, averaging 15 days on the market and selling for 105.19% of the asking price. The lowest was $267,900; the highest was $772,811, and the average price per square foot was $408.00. Six townhouse condos sold, averaging seven days on the market and selling for 101.33% of the asking price—the lowest at $450,000 and the highest at $630,021.

2020

  •   In 2020, 186 homes sold, averaging 7 days to sell and selling for a median of 102.17% of the asking price, ranging from $246,000 to $1,500,000. Nine condos in Old South London changed hands in the same period. The median days to sell were 19, with 103.51% of the asking price, and the range was $139,000 to $472,000.

2019

  •   In 2019, 229 houses changed hands from $230,000 to $1,120,000. These took 16 days to sell on the MLS, with a median sale price of 103.13% of the asking price. Eight condominiums changed hands from a low of $152,100 to a high of $499,000. These averaged eight days on the market and sold for 101.22% of the asking price.      

2018

  • In 2018, real estate sales were robust in Wortley Village, Old South London, Ontario. One hundred ninety-six single-family houses sold for an average price of $404,718. 102.28% of the asking price, and the median time on the market was 20 days! 13 Wortley Village condominiums changed hands, averaging $309,902. These sold for 97.46% of the asking price; condos in Old South London took about 35 days to sell.

What our clients say

Schools:

 Thames Valley District School Board 

District Catholic School Board

Are You Curious About What Your Home Is Worth in Today’s Market?

Also find me at tylacroix.com and Totally Preachless

Read
This website may only be used by consumers that have a bona fide interest in the purchase, sale, or lease of real estate of the type being offered via the website. The data relating to real estate on this website comes in part from the MLS® Reciprocity program of the PropTx MLS®. The data is deemed reliable but is not guaranteed to be accurate.