London Ontario Real Estate. No Fluff. No Sales Pitch. Just the Truth.

 Written by Ty Lacroix — Real Estate Strategist & Broker, London Ontario 

RSS

What the Averages Aren't Telling You About London Ontario Real Estate

London, Ontario's June 2026 market is being reported as "slow" because averages are up only modestly — but averages hide a $200,000 to $500,000 spread within a single neighbourhood. Sellers who understand their specific pocket and price accordingly are moving. Buyers who are waiting for a signal that never comes are already behind. Broker Ty Lacroix breaks down what June actually shows across ten London neighbourhoods — and what it means before you decide anything.

Every week, someone reads a headline that says London home sales are up 2% — and concludes the market is slow. That's not analysis. That's a number without a neighbourhood.

Here's what actually matters: within a single London neighbourhood, there can be a $200,000 to $500,000 spread between one street and the next. A bungalow backing onto green space in Byron is not the same market as a comparable footprint two blocks inland. An executive townhome in Sunningdale is not the same market as a resale detached home in the three subdivisions over. Averaging them together and reporting the result as "the London market" tells you almost nothing useful.

The June 2026 numbers across London's established neighbourhoods tell a more honest story. More homes are on the market — sellers and their realtors know it, and the ones pricing to that reality are selling. Buyers who understand the same thing are acting on it. The ones sitting on the fence waiting for prices to drop further, or for some cleaner signal from the news, are making a decision by not making one — and they'll feel it.

This is what the market looks like right now in the ten neighbourhoods I track every month. Not the average. The actual picture, area by area.

See all ten London neighbourhood updates →

If you're a seller trying to understand what your specific home is worth in this market — not the average, your home — or a buyer trying to read where the real value is before someone else does, that's the conversation I have every day.

Would you like one?

Also find me at tylacroix.com and Totally Preachless

Read

Stop Reading National Headlines: The Real Math Behind Hyde Park London Ontario Real Estate

This is a historical snapshot — the real estate market in Hyde Park, London, Ontario, for February 2026. Markets move month to month. For current stats and my honest read on where each part of the city is actually heading, see my London neighbourhood market updates — ten neighbourhoods, refreshed monthly. Or for what your specific home is worth in today's market, reach out for a personal analysis. No pressure, no pitch.

Let’s get straight to the point: housing has always been local. Right now, it is also increasingly conditional.

If you turn on the news, the national real estate headlines are designed to cause panic or confusion. But national averages don't buy or sell homes in Northwest London. In reality, some homes in our market still move incredibly quickly, while certain micro-neighbourhoods continue to attract heavy, multiple-offer competition.

For buyers and sellers trying to decide what to do next, your focus shouldn't be on decoding the news cycle. It should be on understanding the exact inventory, days on market, and recent price movement right here in Hyde Park.

Here is the Math: When we compare the Hyde Park aggregate data to the London average, you can see exactly why this neighbourhood operates as a highly protected, self-sustaining micro-economy:

  • Average Sale Price ($755,000 vs. $614,104): Stability. Hyde Park's heavy retail infrastructure creates a hard floor on your equity.

  • Absorption Rate (24.1% vs. 18.5%): Liquidity. A broad demographic appeal—from first-time buyers to downsizers—ensures a massive, active pool of buyers.

  • Sale-to-List Ratio (98.2% vs. 96.4%): Precision. Homes priced accurately to current builder comparables move immediately.

  • Days on Market (26 Days vs. 43 Days): Velocity. High-utility, modern layouts in this area are selling nearly twice as fast as the city average.

As a Homeowner in Hyde Park, Why Is This Important to You?

When the market becomes conditional, a blanket approach to selling simply doesn't work. Your home's value isn't determined by what is happening across the country; it is determined by the hyper-local math shown above.

If you were getting ready to sell your largest financial asset, wouldn't it make sense to work with someone who actually knows the neighbourhood? When you work with me, you get someone who knows the Hyde Park stats inside and out, understands the current "buyer temperature," and has the strategic negotiation skills to get you the absolute best price in today's market.

What’s In It For You As A Buyer?

The ultimate luxury in real estate right now: The ability to think before you act.

When you focus on hyper-local data instead of national noise, the entire process slows down in the best way possible. By working together to understand Hyde Park's specific inventory levels and what is actually driving prices on a street-by-street level, you regain control. We cut through the anxiety so you can focus on finding the right home and understanding what you can comfortably afford without stretching beyond reason.

The Local Advantage

Whether you are securing your equity or searching for your next front door, success in Hyde Park right now requires a local lens.

👉 [Explore Active Hyde Park Listings & Local Market Data Here] 

Also find me at tylacroix.com and Totally Preachless

Read

Hyde Park London Ontario Real Estate

This is a historical snapshot — the Hyde Park, London, Ontario market in 2024 and previous years. Markets move month to month. For current stats and my honest read on where each part of the city is actually heading, see my London neighbourhood market updates — ten neighbourhoods, refreshed monthly. Or for what your specific home is worth in today's market, reach out for a personal analysis. No pressure, no pitch.

Here is what is for sale now in Hyde Park on MLS

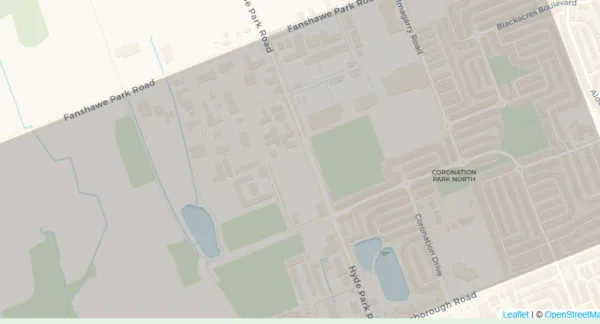
Hyde Park borders Fanshawe Park Road West to the north and east of Wonderland Road North and extends to the southwest corner of Oxford Road W.

A map of Hyde Park London Ontario Used by The MLS systems

Our London Ontario St.Thomas Real Estate Association (LSTAR) uses the above-shaded area, which is mapped as North E. 

A map of Hyde Park London Ontario Used by The MLS systems

North F Boundaries

This article covers the historical real estate market conditions in Hyde Park, London, Ontario, for the listed years. For current market insights, updated stats, or expert guidance, contact me for a personalized analysis.

The Hyde Park, London, Ontario Real Estate Market Area in 2024

Houses Sold Year-To-Date 207Apartment Condos Sold Year-To-Date 8Townhouses/Townhomes Sold Year-To-Date 59
Time on Market 31 daysTime on Market 39 DaysTime on Market  31 days
Price Range $440,000 – $930,000Price Range $350,000 -$535,000Price Range $380,000 -$678,378
% to Asking Price 99.03%% to Asking Price 99.77%% to Asking Price 99.86%

Hyde Park, London Real Estate Market As Per MLS Data, London St. Thomas Association of Realtors (LSTAR)

Prior Year Stats For The Real Estate Market in The Hyde Park, London Area.

Houses Sold Year in 2023 132Apartment Condos Sold in 2023  21Townhouses/Townhomes Sold in 2023 64
Time on Market 26 daysTime on Market 49 daysTime on Market 28 days
Price Range $453,500 – $1,260,000Price Range $305,000 – $523,000Price Range $360,000 – $695,000
% to Asking Price 98.95%% to Asking Price 96.62%% to Asking Price 98.07%

Hyde Park London Real Estate Market As Per MLS Data London St. Thomas Association of Realtors (LSTAR)

2022

  • In 2022186 houses in Hyde Park, London, were sold at prices ranging from $400,000 to $1,400,000. These were on the market for an average of sixteen days! These houses sold for an average of 106.94% of the asking price. Eighty-three townhouse condos in Hyde Park sold, ranging from $349,000 to $875,000. These were on the market for an average of fifteen days and sold for 111.22% of the asking price. Thirteen apartment condos sold, ranging from $439,000 to $625,000. This was 106.54% of the asking price, and the days on the market averaged 17.

2021

  •  In 2021267 houses in Hyde Park, London, sold through MLS, averaging nine days on the market. They sold for 111.34% of the asking price, with the lowest at $435,000 and the highest at $1,270,000. Nine apartment condos at 1030 Coronation Drive in the Hyde Park neighbourhood of London sold. 110 townhouse condos and townhomes in Hyde Park sold, averaging 7 days on the market. These sold for 109.11% of the asking price, ranging from $385,000 to $780,000.

2020

  • In 2020, 251 houses in Hyde Park were sold through our MLS system. The lowest price was $285,000, the highest $1,200,000, and they sold on average in nine days. These sold for a median of 101.89% of the asking price! 102 condos and townhouses in Hyde Park sold for prices ranging from $250,000 to $527,000. These took 11 days to sell for 100.71% of the asking price.

2019

  • In 2019, 281 houses in Hyde Park were sold through MLS, ranging from $238,000 to $825,00000. On average, a house in Hyde Park took 30 days to sell for 101.65% of the asking price. 106 townhouses and apartment condos were sold. Prices ranged from $235,500 to $630,000, with 101% of the asking price.

2018

  •  In 2018, 245 houses in Hyde Park sold for a median price of 102.19% of the asking price. These took about 22 days to change hands, with an average price of $429,302. In Hyde Park, 98 condominiums, including apartment-style and townhouses, sold. The median sold price was $299,553, 101.54%  of the asking price, and it took about 25 days to trade.

The Hyde Park Business Improvement Association, the Hyde Park Rotary Club, and other groups do an excellent job organizing events and activities.

Want to know what is for sale now in Hyde Park, London, Ontario, on MLS?

Also find me at tylacroix.com and Totally Preachless

Read
This website may only be used by consumers that have a bona fide interest in the purchase, sale, or lease of real estate of the type being offered via the website. The data relating to real estate on this website comes in part from the MLS® Reciprocity program of the PropTx MLS®. The data is deemed reliable but is not guaranteed to be accurate.