London Ontario Real Estate. No Fluff. No Sales Pitch. Just the Truth.

 Written by Ty Lacroix — Real Estate Strategist & Broker, London Ontario 

RSS

How To Price A Home To Sell in London Ontario

Most London, Ontario homeowners already have a price in mind before they call anyone — and most of those prices are based on emotion, neighbour comparisons, or what a relative thinks the home is worth. None of those inputs have any bearing on what a buyer will pay. Pricing a home correctly in today's market means separating what the home means to you from what it's worth to the person who doesn't share your memories, your renovations, or your mortgage balance. According to current LSTAR data, London homes are selling at 97.4% of asking in a median of 26 days — which means the market is precise and buyers are informed. Ty Lacroix, Broker at The Envelope Real Estate Group, has spent 24 years helping London sellers arrive at the right number before the sign goes up — not after the listing goes stale.

Are you wondering what your home in London, Ontario would actually sell for? Most sellers have already run the number through four internal filters before they've spoken to anyone:

I'd love to get this much.
I'd be happy with this.
I'd have to really think about that.
There's no way I'd consider that.

The problem is that none of those four filters have anything to do with what a buyer will pay. Here's how to think about pricing in a way that actually protects you.

The First Thing to Set Aside

Set aside your perspective on your home's value — at least temporarily. You've invested time, money, and memory into making it your home. A buyer doesn't share any of that. They don't see the renovation you completed in 2019, the garden you built from scratch, or the neighbourhood relationships you've built over the years. They see a property, compare it to everything else available for the same money, and make a decision based on what the market tells them it's worth — not what it means to you.

What that means for you: the most expensive pricing mistakes sellers make almost always come from anchoring to personal value rather than market value. The two are often different numbers, and the gap between them is where equity gets left on the table.

What Doesn't Determine Your Home's Price

What your friend at work or a relative thinks. They mean well. They don't have access to current comparable sales, they don't know your specific neighbourhood's absorption rate, and they have no professional accountability for what happens if their number is wrong.

What your neighbour's house sold for two years ago. Two years is a long time in real estate. The market that existed in 2022 or 2023 is not the market that exists today. Pricing to a peak that has passed is one of the most common and costly mistakes in London's current market.

What Actually Helps

A Comparative Market Analysis. A CMA shows you what comparable homes have actually sold for in your area, recently, under current market conditions. Ask which homes were included and why — and which were excluded. A CMA is one of the best tools for establishing a realistic price range, but it's a starting point, not a final answer.

Visiting other active listings as a buyer would. Before you price your home, walk through a few comparable properties with the impartial eye of a buyer — not a homeowner. What do buyers see when they compare your home to what else is available at the same price? Is your home the obvious choice, or is it competing against something better positioned?

Understanding price per square foot — and its limits. Price per square foot is a useful comparison tool for apartment condos, where units in the same building have similar finishes and construction. For houses, it's far less reliable — different finishes, styles, lots, and conditions make direct square-foot comparisons misleading.

Knowing whether it's a buyer's or seller's market. London currently sits at approximately 5 months of inventory — balanced, edging toward buyer-friendly. Homes priced correctly are moving in about 26 days at 97.4% of asking. Homes priced optimistically are sitting and eventually selling for less than they would have if priced right from the start.

Knowing whether you need to sell. Motivation matters. A seller who must sell in 60 days prices differently than one who can wait for the right buyer. Knowing your own position clearly — and keeping it private from the other side — is part of the strategy.

The Right Starting Point

Pricing a home to sell in London isn't a formula. It's a combination of current comparable data, an honest assessment of your home's condition and position relative to the competition, an understanding of the market's direction, and a clear-eyed read of your own timeline and motivation.

I use a 60-point home audit and valuation process that addresses all of these factors — and that gives sellers a number grounded in what the market will actually bear, not what would be nice to hear. If you're thinking about selling in London and want an honest, data-backed starting point before you commit to anything, that's the conversation to have first.


Ready for a straight read on what your home is actually worth in today's London market? Reach out for a private conversation — no pressure, no pitch.

See how the full selling process actually works: How Selling Your Home Actually Works in London, Ontario →

Read

12 Important Steps Selling A Home in London Ontario

Selling a home in London, Ontario involves more than a sign on the lawn and a listing on MLS. These 12 steps — built from 24 years and hundreds of London transactions — are the foundation of a sale that goes smoothly, nets you the most money, and keeps you in control throughout. The average London home is currently selling in 26 days at 97.4% of asking price, according to LSTAR. That's a precise market. Sellers who prepare properly come out ahead. Sellers who wing it don't. Ty Lacroix, Broker at The Envelope Real Estate Group, follows 187 steps in every transaction — these 12 are where it starts.

Follow these 12 steps when selling a home in London, Ontario. They won't guarantee a perfect outcome — nothing does — but they'll help your home sell faster, at the price you want, with less stress and more control than most sellers experience.

Step 1: Keep Your Motivation Private

Why you're selling is your business — and your broker's. Nobody else needs to know. If anyone asks, the answer is that your housing needs have changed. Disclosing urgency, a job transfer, a relationship change, or financial pressure gives a buyer negotiating leverage you can't get back.

Step 2: Know What Matters Most to You

Different goals require different strategies. Is the priority the money you walk away with? How quickly the home sells? Or both equally? Knowing your own answer before you list — and making sure your broker knows it too — ensures the strategy is built around your actual objective, not a generic one.

Step 3: Do Your Homework Before Setting a Price

The average buyer is comparing your home to multiple others in the same price range at once. If your home doesn't compare favourably — in condition, features, or value — buyers won't take it seriously. Homes that don't stand up to comparison sit. And homes that sit develop a quiet reputation: buyers assume something is wrong, even when nothing is.

Step 4: The Discovery — Know Your Market

Before settling on a price, pull four numbers from your local market:

What comparable homes in your neighbourhood have sold for in the last 6 to 12 months. What's currently listed for sale — your direct competition. How long those listings have been on the market. The percentage of the sale price to the asking price. In London right now, that figure is 97.4%, meaning homes are selling at about 2.6% below asking in a median of 26 days. That's your starting point — not hope, not what your neighbour got two years ago.

Step 5: Maximize Your Home's Sales Potential

You can't change your home's location or floor plan. You can change how it shows. The look and feel of a home generates a stronger emotional response in buyers than any other factor — and buyers make emotional decisions. Before every showing: pick up, straighten, declutter, scrub, and dust. The goal is a genuine "wow" from a buyer who can picture their life in the space, not yours.

Step 6: Choose Your Broker Carefully

You and your Realtor are partners in marketing, pricing, and negotiating your home. Negotiating strength is paramount. The support systems, local knowledge, and tools they bring to handle any situation matter — especially when something unexpected happens, as it almost always does at some point in a transaction.

Step 7: Make It Easy for Buyers to Get Information

Buyers who call about your home value their time as much as you do. They don't want to be frustrated by an unreachable agent or inaccurate listing details. The overwhelming majority of buyers preview homes online before visiting in person — which means your listing's photography, floor plans, and virtual tour are doing the selling before any showing is booked. Make sure they're doing it well.

Step 8: Don't Move Out Before You Sell

Studies consistently show that vacant homes are harder to sell. An empty home looks forgotten and uninviting. It also signals to buyers that you're motivated to move quickly — and they'll price their offer accordingly. If you can keep the home furnished and presented until it sells, do it.

Step 9: Avoid Artificial Deadlines

Don't try to sell by a specific date unless you absolutely have to. Self-imposed deadlines create pressure that transfers to the negotiating table — and pressure is a disadvantage. Let the market and the right buyer set the timeline, not a date on a calendar.

Step 10: Don't Take Low Offers Personally

A low offer is not an insult — it's an opening position. An experienced broker can turn a weak opening offer into a strong final outcome. Sellers who react emotionally to a low number often lose the buyer entirely. Sellers who stay calm and strategic keep the negotiation alive and usually close better.

Step 11: Disclose Everything

Be proactive about disclosing known issues or defects. It gives buyers confidence that you're dealing honestly — which actually strengthens your negotiating position rather than weakening it. It also protects you from legal exposure after closing. Disclosure is not a weakness. It's the foundation of a clean, defensible transaction.

Step 12: Make Sure the Offer Is Complete

Before you sign anything, make sure every term, condition, and responsibility is clearly stated and fully understood. A thorough broker takes the time to explain what you're agreeing to, inserts protective clauses where needed, and ensures nothing is left ambiguous. Vague offers come back to haunt sellers at the worst possible moment — usually on or near closing day.

These 12 steps are the foundation — not the full picture. There are 187 steps I follow in every transaction. These are the ones that prevent the most common, most expensive mistakes. If you're thinking about selling in London and want to understand what the full process actually looks like before you commit to anything, that's exactly the right place to start.


Ready to sell with a plan instead of a hope? Reach out for a private conversation — no pressure, no pitch.

See how the full selling process actually works: How Selling Your Home Actually Works in London, Ontario →

Read

A Real Estate Conundrum: Buy or Sell First?

Buy or sell first? It's the most common real estate conundrum London, Ontario homeowners face — and whatever you choose carries real risk. Selling first gives you certainty on your proceeds but puts you under time pressure to find the right home before your closing date. Buying first removes that pressure but requires bridge financing and the confidence that your current home will sell at the right price. In today's London market, where sellers expect firm offers and sale-of-home conditions are rarely accepted, buying first is almost always the more controlled strategy — if you have the right plan in place. Ty Lacroix, Broker at The Envelope Real Estate Group, has guided hundreds of London homeowners through this decision over 24 years and knows exactly how to sequence a move so you stay in control.

The most pressing real estate conundrum for most London, Ontario homeowners is also the most honest one: should I buy first, or sell first? And the honest answer is that whatever you choose carries risk. Knowing what those risks are upfront — and having a plan to manage them — is what separates a smooth transition from a stressful one.

As La Rochefoucauld observed: "The truest way to be deceived is to think oneself more knowing than others."

If You Sell First

Selling first gives you one significant advantage: you know exactly what you're working with. The proceeds are confirmed, the financing picture is clear, and there's no uncertainty about whether your current home will sell before you need it to.

The disadvantage is equally significant. The moment you accept an offer, you have a closing date — and now you're under pressure to find the right home, in the right neighbourhood, at the right price and condition, before that date arrives. If the right home isn't available, you have two choices: settle for something that isn't quite right, or scramble for temporary housing while the search continues. Neither is comfortable, and both are expensive in different ways.

If You Buy First

Buying first is the more controlled approach — and the one I recommend for most clients who are in a position to do it.

When you buy first, there's no deadline forcing your hand on the purchase. You can find the right home, negotiate from a position of patience rather than urgency, and take possession when the timing works for you. Once you have a firm agreement on your new home and a confirmed closing date, you list your current home with a clear strategy and a known timeline. You're in the driver's seat.

The discomfort is the financing gap between the two closings. Most people immediately assume this is a bigger problem than it is. Bridge financing — a short-term loan that covers the gap between your purchase closing and your sale closing — is available through most lenders and is often less expensive than people expect. If you have significant equity in your current home, your broker and your lender can help you structure this cleanly before you ever make an offer on the new property.

The Condition That Used to Help — and Rarely Works Anymore

In an earlier market, you could make an offer on a new home conditional on the sale of your current one. That condition gave buyers a safety net — if the current home didn't sell, the purchase didn't proceed. Today, sellers in London expect firm offers. Sale-of-home conditions are rarely accepted in today's market, because sellers want certainty, not a conditional commitment that may never firm up. Bump clauses exist, but they create their own complications. In most cases, a conditional purchase simply isn't a viable strategy anymore.

The Decision That Keeps You in Control

The buyers and sellers I see struggling most are the ones who sold first without a plan for what comes next, then found themselves rushing — making compromises on the purchase they'll feel for years.

The ones who navigate this best are the ones who understood the sequence before they started. Buy first, with bridge financing in place; list the current home with a strategy and timeline; and close both transactions in order. No rushing. No settling. No sleeping on a friend's couch between closings.

As Carl Richards wrote: "Risk is left over after you've thought of everything." The goal isn't to eliminate risk — it's to minimize what's left after a clear plan has accounted for everything it can.

If you're facing this decision in London and want to map out the right sequence for your specific situation — financing, timing, market conditions, and all — that's exactly the conversation to have before anything is listed or offered.

[CTA block]
Buy or sell first? Let's map out the right sequence for your specific situation. Reach out for a private conversation — no pressure, no pitch.

See how the full selling process actually works: How Selling Your Home Actually Works in London Ontario

Read

Riverbend London, Ontario Real Estate

This is a historical snapshot — the Riverbend market in London, Ontario, in 2024 and previous years. Markets move month to month. For current stats and my honest read on where each part of the city is actually heading, see my London neighbourhood market updates — ten neighbourhoods, refreshed monthly. Or for what your specific home is worth in today's market, reach out for a personal analysis. No pressure, no pitch.

The Riverbend real estate market in London, Ontario, has changed considerably over the last few years, with many options. The availability of apartment buildings, townhouses, and single-family homes has increased, as has the availability of the West 5 development.

Riverbend, London, Ontario, is a neighbourhood in the southwest part of London; take Oxford Street West to Kains Road. The rapid growth of retail, services, and offices along Oxford West provides nearby residents with essential amenities.

The gated Riverbend Golf Community is attractive and offers its members security, clubhouse facilities and dining. The Riverbend area is within 11 minutes of downtown London. There are great nature trails, bike paths, golfing, or simply doing nothing; you will enjoy the quiet. Five golf courses are within 4 km.

The walking trail along the Thames River (Kains Woods -Upper Thames River Conservation) is a gem for nature lovers. Nearby are the Warbler Woods Conservation Area and Komoka Provincial Park.

Here is What Is For Sale in The Riverbend Area Now on MLS

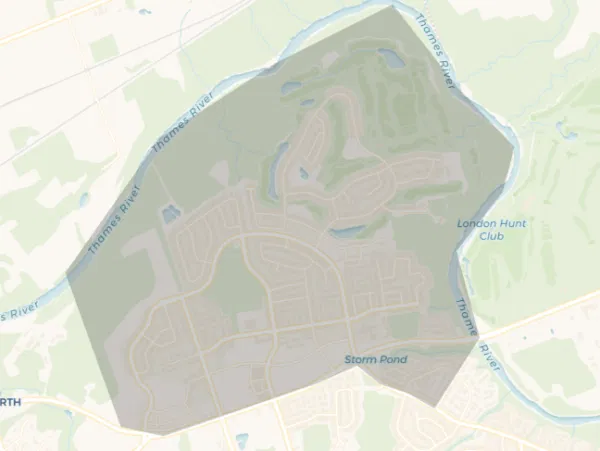
Riverbend map used by MLS

Our London, Ontario St. Thomas Real Estate Association (LSTAR) uses the above-shaded area, which is mapped as South A.

Homes Sold in The Riverbend, London, Ontario Area in 2024

Houses Sold in 2024 42Townhouses/Townhomes Sold Year to Date in 2024 12
Time on Market 65 daysTime on Market 36 days
Price Range $650,000 – $1,730,000Price Range $657,500 -$815,000
% to Asking Price 98.44%% to Asking Price 98.20%

Riverbend, London, Ontario, Real Estate Market Area Data as per MLS London St.Thomas Association of Realtors (LSTAR)

Previous Years’ Sales in The Riverbend London Area

Below are the historical real estate market conditions for London, Ontario, for the listed years for Riverbend London. For current market insights, updated stats, or expert guidance, contact me for a personalized analysis.

Houses Sold in 2023 51Townhouses/Townhomes Sold Year in 2023 39
Time on Market 36 daysTime on Market 26 days
Price Range $701,000 – $2,025,000Price Range $510,000 – $910,000
% to Asking Price 97.13%% to Asking Price 99.10%

Riverbend, London, Ontario, Real Estate Market Area Data as per MLS London St.Thomas Association of Realtors (LSTAR)

2022

In 202255 houses in Riverbend London sold with prices ranging from $740,000 to $1,695,000. This was 101.16% of the asking price, and these took an average of 23 days to sell. Five apartment-condos at 2050 Linkway were sold through the MLS. Averaging $512.00 per square foot, with prices ranging from $806,000 to $907,000. Thirty townhouses & townhomes in Riverbend London sold with prices ranging from $635,000 to $1,075,000. This was 109.26% of the asking price, and these 30 averaged 23 days on the market before selling.

2021

In 2021, 58 houses were sold in the Riverbend neighbourhood of London. Averaging 23 days to sell for 107% of the asking price. The final sale prices ranged from $675,000 to $1,790,000. Twenty-eight townhomes sold for 113.17% of the asking price. These took an average of nine days to sell and sold for prices ranging from $565,000 to $820,000. Eleven apartment condos sold at 2050 Linkway, averaging $453.00 per square foot, with prices ranging from $594,000 to $881,000.

2020

In 2020, 65 houses in the Riverbend neighbourhood of West London sold through the MLS at 99.92% of the asking price. The lowest is $503,000, and the highest is $2,650,000. For townhouses & townhomes in Riverbend, 22 changed hands, ranging from $449,900 to $520,532. This was 100.07% of the asking price and averaged 15 days on the market.

2019

 In 2019, our MLS system sold 77 homes in the Riverbend London neighbourhood. Prices ranged from $399,000 to $ 1,070,000, and listings averaged 34 days on the market. The median selling price was 99.91% of the asking price.

2018

  In 2018, 82 homes were sold through our local MLS in the Riverbend neighbourhood in London, Ontario. The average selling price was $681,665. This was 99.62% of the asking price. The median number of days to sell was 40. The lowest price was $366,697, and the highest was $1,500,000.

Why Children Like The Gated Riverbend Golf Community in London, Ontario

We always used to spend the holidays with Grandma and Grandpa.   They used to live in a big brick house, but Grandpa got retarded, and they moved to the Riverbend Golf Community, where everyone lives in beautiful little homes, so they don’t have to mow the grass anymore!

They ride around on their bicycles and scooters and wear name tags because they don’t know who they are anymore. They go to a wreck centre building, but they must have fixed it because it is okay now.

They do exercises there, but they don’t do them very well.   There is a swimming pool, but they all jump up and down in it with hats. At their gate, there is a dollhouse with a little old man sitting in it.

He watches all day so nobody can escape. Sometimes they sneak out and go cruising in their golf carts!

Nobody there cooks; they eat out. And, they eat the same thing every night — early birds.

Some of the people can’t get out past the man in the dollhouse. The ones who do get out bring food back to the wrecked centre for a potluck.

My Grandma says that Grandpa worked all his life to earn his retardment and thinks I should work hard so I can be retarded someday too.

When I earn my retardment, I want to be the man in the dollhouse. Then I will let people out, so they can visit their grandchildren.

Want to know what is for sale now on MLS in Riverbend, London?

Read

Hyde Park London Ontario Real Estate

This is a historical snapshot — the Hyde Park, London, Ontario market in 2024 and previous years. Markets move month to month. For current stats and my honest read on where each part of the city is actually heading, see my London neighbourhood market updates — ten neighbourhoods, refreshed monthly. Or for what your specific home is worth in today's market, reach out for a personal analysis. No pressure, no pitch.

Here is what is for sale now in Hyde Park on MLS

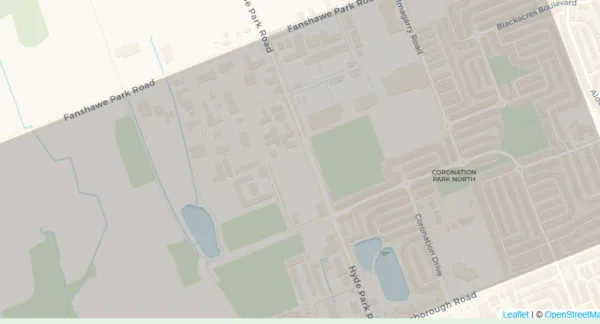
Hyde Park borders Fanshawe Park Road West to the north and east of Wonderland Road North and extends to the southwest corner of Oxford Road W.

A map of Hyde Park London Ontario Used by The MLS systems

Our London Ontario St.Thomas Real Estate Association (LSTAR) uses the above-shaded area, which is mapped as North E. 

A map of Hyde Park London Ontario Used by The MLS systems

North F Boundaries

This article covers the historical real estate market conditions in Hyde Park, London, Ontario, for the listed years. For current market insights, updated stats, or expert guidance, contact me for a personalized analysis.

The Hyde Park, London, Ontario Real Estate Market Area in 2024

Houses Sold Year-To-Date 207Apartment Condos Sold Year-To-Date 8Townhouses/Townhomes Sold Year-To-Date 59
Time on Market 31 daysTime on Market 39 DaysTime on Market  31 days
Price Range $440,000 – $930,000Price Range $350,000 -$535,000Price Range $380,000 -$678,378
% to Asking Price 99.03%% to Asking Price 99.77%% to Asking Price 99.86%

Hyde Park, London Real Estate Market As Per MLS Data, London St. Thomas Association of Realtors (LSTAR)

Prior Year Stats For The Real Estate Market in The Hyde Park, London Area.

Houses Sold Year in 2023 132Apartment Condos Sold in 2023  21Townhouses/Townhomes Sold in 2023 64
Time on Market 26 daysTime on Market 49 daysTime on Market 28 days
Price Range $453,500 – $1,260,000Price Range $305,000 – $523,000Price Range $360,000 – $695,000
% to Asking Price 98.95%% to Asking Price 96.62%% to Asking Price 98.07%

Hyde Park London Real Estate Market As Per MLS Data London St. Thomas Association of Realtors (LSTAR)

2022

  • In 2022186 houses in Hyde Park, London, were sold at prices ranging from $400,000 to $1,400,000. These were on the market for an average of sixteen days! These houses sold for an average of 106.94% of the asking price. Eighty-three townhouse condos in Hyde Park sold, ranging from $349,000 to $875,000. These were on the market for an average of fifteen days and sold for 111.22% of the asking price. Thirteen apartment condos sold, ranging from $439,000 to $625,000. This was 106.54% of the asking price, and the days on the market averaged 17.

2021

  •  In 2021267 houses in Hyde Park, London, sold through MLS, averaging nine days on the market. They sold for 111.34% of the asking price, with the lowest at $435,000 and the highest at $1,270,000. Nine apartment condos at 1030 Coronation Drive in the Hyde Park neighbourhood of London sold. One hundred ten townhouse condos and townhomes in Hyde Park sold, averaging seven days on the market. These sold for 109.11% of the asking price, ranging from $385,000 to $780,000.

2020

  • In 2020, 251 houses in Hyde Park were sold through our MLS system. The lowest price was $285,000, the highest $1,200,000, and they sold on average in nine days. These sold for a median of 101.89% of the asking price! One hundred two condos and townhouses in Hyde Park sold for prices ranging from $250,000 to $527,000. These took 11 days to sell for 100.71% of the asking price.

2019

  • In 2019, 281 houses in Hyde Park were sold through MLS, ranging from $238,000 to $825,00000. On average, a house in Hyde Park took 30 days to sell for 101.65% of the asking price. One hundred six townhouses and apartment condos were sold. Prices ranged from $235,500 to $630,000, with 101% of the asking price.

2018

  •  In 2018, 245 houses in Hyde Park sold for a median price of 102.19% of the asking price. These took about 22 days to change hands, averaging $429,302. In Hyde Park, 98 condominiums, including apartment-style and townhouses, sold. The median sold price was $299,553, 101.54%  of the asking price, and it took about 25 days to trade.

HPBIA Logo

The Hyde Park Business Improvement Association, the Hyde Park Rotary Club, and other groups do an excellent job organizing events and activities.

client testimonials

Want to know what is for sale now in Hyde Park, London, Ontario, on MLS?

Read

Old South London Ontario Real Estate

This is a historical snapshot — The Old South London Wortley Village market in 2024 and previous years. Markets move month to month. For current stats and my honest read on where each part of the city is actually heading, see my London neighbourhood market updates — ten neighbourhoods, refreshed monthly. Or for what your specific home is worth in today's market, reach out for a personal analysis. No pressure, no pitch.

Why Old South London and Wortley Village?

The character and charm of this great London neighbourhood is quite evident. Residents of Old South love the ability to walk and shop in the Wortley Village core—no wonder, with tree-lined streets and very few cookie-cutter homes.

There are more than 80 small businesses and establishments in Wortley Village, along with the Library and the YMCA.

Wortley Village BIA

The Old South Wortley Village Business Association does an excellent job hosting and presenting community events.

Here is what is for sale in Old South London on MLS

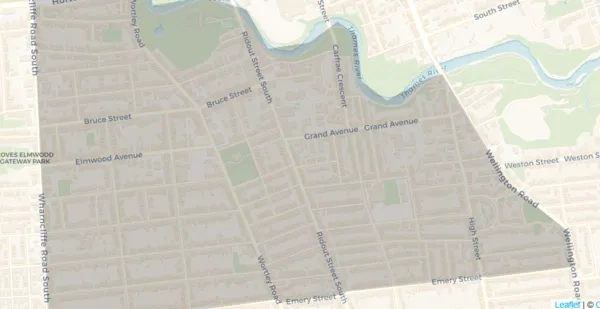
London South G map boundaries

Our London, Ontario, St. Thomas Real Estate Association (LSTAR) uses the shaded area shown above, mapped as South F.

London South F map boundaries

This article covers historical real estate market conditions in Old South London and Wortley Village, London, Ontario, for the listed years. For current market insights, updated stats, or expert guidance, contact me for a personalized analysis.

What Sold in 2024 in Old South London & Wortley Village

Houses Sold in 2024, 158Apartment Condos Sold in2024, 4Townhouses/Townhomes Sold in 2024 2
Time on Market 27 daysTime on Market 15 daysTime on Market 33 days
Price Range $260,000 – $1,500,000Price Range $477,000 -$1.070,,000Price Range $575,000-$750,000
% to Asking Price 99%% to Asking Price 101%% to Asking Price 100%

Old South London Area Data from MLS London St. Thomas Association of Realtors (LSTAR)

2023 Old South London Real Estate Market

Houses Sold in 2023 150Apartment Condos Sold in 2023 5Townhouses/Townhomes Sold Year To Date 0
Time on Market 21 daysTime on Market 33 daysTime on Market N/A
Price Range $302,500 – $1,600,000Price Range $255,000 – $549,900Price Range N/A
% to Asking Price 100.78%% to Asking Price 99.47%% to Asking Price N/A

Old South London, Ontario Real Estate Data provided by MLS London St.Thomas Association of Realtors (LSTAR)

2022

  • In 2022, 168 houses in Old South London were sold, with an average time to sell of 15 days. They sold for an average of 110.94% of the asking price, with prices ranging from $359,900 to $2,100,000. Nine apartment condos sold, and the average days on the market to sell through MLS was 23. The sold prices averaged 110.94% of the asking price, ranging from $500,000 to $1,200,000. Two townhouses sold, one at 30 Grand for $540,000 and one at 352 Ridout for $800,000.

2021

  • In 2021, 242 houses in Old South London, including Wortley Village, sold through MLS, averaging twelve days on the market. They sold for 111.03% of the asking price, with the lowest at $285,000 and the highest at $2,050,000. Thirteen apartment condos sold in Wortley Village in Old South London, averaging 15 days on the market and selling for 105.19% of the asking price. The lowest was $267,900; the highest was $772,811, and the average price per square foot was $408.00. Six townhouse condos sold, averaging seven days on the market and selling for 101.33% of the asking price—the lowest at $450,000 and the highest at $630,021.

2020

  •   In 2020, 186 homes sold, averaging 7 days to sell and selling for a median of 102.17% of the asking price, ranging from $246,000 to $1,500,000. Nine condos in Old South London changed hands in the same period. The median days to sell were 19, with 103.51% of the asking price, ranging from $139,000 to $472,000.

2019

  •   In 2019, 229 houses changed hands from $230,000 to $1,120,000. These took sixteen days to sell on MLS at a median of 103.13% of the asking price. Eight condominiums changed hands from a low of $152,100 to a high of $499,000. These averaged eight days on the market and sold for 101.22% of the asking price.      

2018

  • In 2018, real estate sales were robust in Wortley Village, Old South London, Ontario. One hundred ninety-six single-family houses sold for an average price of $404,718. 102.28% of the asking price, and the median time on the market was 20 days! 13 Wortley Village condominiums changed hands, averaging $309,902. These sold for 97.46% of the asking price; condos in Old South London took about 35 days to sell.

What our clients say

Schools:

 Thames Valley District School Board 

District Catholic School Board

Are You Curious About What Your Home Is Worth in Today’s Market?

Read

Westmount, London, Ontario Real Estate Market

The Westmount, London, Ontario, real estate market is ever-changing! It includes a combination of newer and older homes and condominiums, including townhouses, townhomes, and apartment buildings.

The Westmount London Neighbourhood Has Four Distinct Areas:

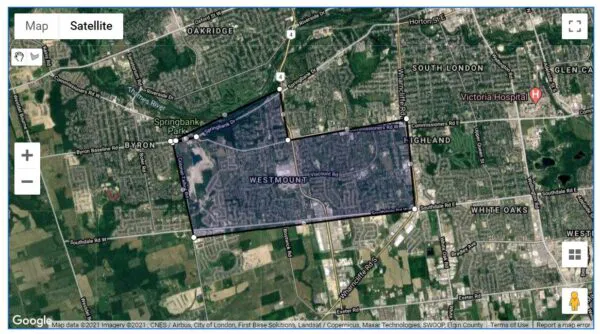
There are four MLS areas designated by the London St. Thomas Association of Realtors: South L, South M, South N, and South O. 

Extending Wonderland Road South to the 402 makes travelling west or east much easier and quicker. Beautiful Springbank Park features 19 miles of trails and picnic areas, including nearby Storybook Gardens.

Westmount Mall has evolved from a retail mall to a mixed-use medical/office and retail complex with a Cineplex theatre. Big-box stores, services, and restaurants are farther along Wonderland Road South. Along Southdale West, the Bostwick Community Centre, Library, and YMCA are open and expanding their services.

Here is What Is For Sale Now in Westmount London Ontario on MLS

Westmount London Ontario Real Estate Market in 2024

This is a historical snapshot — the Westmount, London, Ontario market in 2024. Markets move month to month. For current stats and my honest read on where each part of the city is actually heading, see my London neighbourhood market updates — ten neighbourhoods, refreshed monthly. Or for what your specific home is worth in today's market, reach out for a personal analysis. No pressure, no pitch.

Houses Sold in 2024 146Apartment Condos Sold in 2024 17Townhouses/Townhomes Sold in 2024 78
Time on Market 26 daysTime on Market 37 daysTime on Market 35 days
Price Range $440,000 – $1,460,000Price Range $240,000 – $584,900Price Range $305,000 – $980,000
% to Asking Price 98.82%% to Asking Price 96.47%% to Asking Price 98.71%

Westmount London Ontario Real Estate Market MLS Stats from The London St. Thomas Association of Realtors

Prior year’s sales history for Westmount London

another sold sign that Ty Lacroix has completed
Houses Sold in 2023 156Apartment Condos Sold in 2023 23Townhouses/Townhomes Sold in 2023 75
Time on Market 21 daysTime on Market 23 daysTime on Market 24 days
Price Range $430,000 – $2,075,000Price Range $280,000 – $727,980Price Range $350,000 – $750,000
% to Asking Price 100.31%% to Asking Price 98.88%% to Asking Price 98.31%

Westmount London Ontario Real Estate Market MLS Stats from The London St. Thomas Association of Realtors

2022

  • In 2022, 157 houses were sold in Westmount, London, with an average days-on-market of 16. The average sold price was 109.83% of the asking price. The sold prices for houses ranged from $380,000 to $1,575,000. 102 townhouse & townhome condos were sold within an average of sixteen days. Sold prices ranged from $325,000 to $838,000, averaging 110.29% of the asking price. Twenty-four apartment condos sold on an average of 17 days, and sold prices ranged from $224,000 to $566,000, 110.20% of the asking price!

2021

  • In 2021, 158 houses in Westmount, London, sold through MLS, averaging eight days on the market! Selling prices ranged from $495,000 to $1,170,007, 111.81% of the asking price. Thirty-two apartment condos in Westmount, London, were sold through MLS. These averaged eight days on the market and sold for 113.35% of the asking price. The lowest is $260,000; the highest is $661,000.  Fifty-seven townhouses or townhomes in the Westmount London area were sold. These averaged ten days on the market and sold for 113.70% of the asking price. The low is $350,000; the highest is $815,000.

2020

  •  In 2020, 138 houses changed hands, with the lowest at $356,000 and the highest at $1,066,000. The median selling price was 103.62% of the asking price, and listings averaged 16 days on the market. In Westmount, London, 84 apartment condos and townhouses changed hands. Prices ranged from $172,600 to $669,900, averaging 105.7% of the asking price, with only seven on the market. 

2019

  • In 2019, 139 houses were sold through the MLS in Westmount, London, Ontario, ranging from $340,000 to $1,299,900. These took 24 days to sell for 100.55% of the asking price. For townhouses and apartment condos, 97 changed hands. Prices ranged from $157,500 to $ 492,000, with a median of 104.83% of the asking price, sold in about fourteen days.

2018

  • In 2018, 168 houses were sold in the Westmount neighbourhood of London for an average price of $486,522. This was 102.38% of the asking price and took an average of nine days to change hands. In Westmount, London, Ontario, 84 condominiums were sold. Prices ranged from $ 110,000 to $473,900. Sixteen days on the market was the average to trade for 105.69% of the asking price!

Westmount, London, Ontario, Neighbourhood Map

Westmount London Map used by MLS

.Thames Valley District School Board

.London District Catholic School Board

Testimonial About What Our Clients Say About Envelope Real Estate Group

What our clients say about Ty Lacroix

Read
This website may only be used by consumers that have a bona fide interest in the purchase, sale, or lease of real estate of the type being offered via the website. The data relating to real estate on this website comes in part from the MLS® Reciprocity program of the PropTx MLS®. The data is deemed reliable but is not guaranteed to be accurate.