London Ontario Real Estate. No Fluff. No Sales Pitch. Just the Truth.

 Written by Ty Lacroix — Real Estate Strategist & Broker, London Ontario 

RSS

What the Averages Aren't Telling You About London Ontario Real Estate

London, Ontario's June 2026 market is being reported as "slow" because averages are up only modestly — but averages hide a $200,000 to $500,000 spread within a single neighbourhood. Sellers who understand their specific pocket and price accordingly are moving. Buyers who are waiting for a signal that never comes are already behind. Broker Ty Lacroix breaks down what June actually shows across ten London neighbourhoods — and what it means before you decide anything.

Every week, someone reads a headline that says London home sales are up 2% — and concludes the market is slow. That's not analysis. That's a number without a neighbourhood.

Here's what actually matters: within a single London neighbourhood, there can be a $200,000 to $500,000 spread between one street and the next. A bungalow backing onto green space in Byron is not the same market as a comparable footprint two blocks inland. An executive townhome in Sunningdale is not the same market as a resale detached home in the three subdivisions over. Averaging them together and reporting the result as "the London market" tells you almost nothing useful.

The June 2026 numbers across London's established neighbourhoods tell a more honest story. More homes are on the market — sellers and their realtors know it, and the ones pricing to that reality are selling. Buyers who understand the same thing are acting on it. The ones sitting on the fence waiting for prices to drop further, or for some cleaner signal from the news, are making a decision by not making one — and they'll feel it.

This is what the market looks like right now in the ten neighbourhoods I track every month. Not the average. The actual picture, area by area.

See all ten London neighbourhood updates →

If you're a seller trying to understand what your specific home is worth in this market — not the average, your home — or a buyer trying to read where the real value is before someone else does, that's the conversation I have every day.

Call me, Ty Lacroix, directly at 519-435-1600 or reach out here.

Read

How Long Does It Take To Sell a Home In Westmount, London, Ontario?

This is a historical snapshot — the real estate market in Westmount, London, Ontario, in mid-April 2026. Markets move month to month. For current stats and my honest read on where each part of the city is actually heading, see my London neighbourhood market updates — ten neighbourhoods, refreshed monthly. Or for what your specific home is worth in today's market, reach out for a personal analysis. No pressure, no pitch.

If you are evaluating the sale of your property in Westmount this spring, or want to move into the neighbourhood, relying on outdated city-wide averages is a severe liability. Real estate is hyper-local, and protecting your equity requires precision, not guesswork.

Heading into late April 2026, the baseline metric you need to understand is 24 Days on Market (DOM).

While the broader London average sits closer to 41 days, Westmount operates with immense geographic efficiency. Whether your asset is a functional 1970s layout in Norton Estates or an executive, city-view property on Rosecliffe, the demand in Southwest London remains highly insulated.

Here is the exact market math driving Westmount’s current liquidity:

  • Average Sale Price: $724,050

  • Sale-to-List Ratio: 100.34%

  • Absorption Rate: 22.3%

The Reality Behind the 24-Day Average:

An average of 24 days does not mean every property sells in three weeks. It means that properties priced with precision and marketed to the right demographic move swiftly, while poorly positioned homes stagnate.

Westmount attracts a massive pool of buyers—from first-time homeowners seeking mature tree canopies to medical professionals targeting Reservoir Estates for immediate proximity to hospitals. However, this buyer pool is highly educated. They are actively competing for reliability, and they will not overpay for a property that requires major updates if the list price doesn't reflect that reality.

The Risk of the Generalist Approach. 

When a neighbourhood is operating at a 100.34% sale-to-list ratio, the greatest mistake a homeowner can make is assuming the area’s reputation will do the heavy lifting. Wading into a 24-day market with a generalist broker and a generic marketing plan often results in lost leverage. If your home sits on the market for 45 days in an area where the standard is 24, buyers will immediately assume there is a defect, and lowball offers will follow.

What This Means for Buyers Evaluating Westmount

For buyers, Westmount’s 24-day market velocity and 100.34% sale-to-list ratio signal one undeniable reality: you are competing for reliability, and hesitation is expensive. Wading into Southwest London's highest-utility hub without a hyper-local strategy guarantees you will either miss out on prime, mature streets like Cranbrook or blindly overpay for a 1970s property that requires major capital updates.

Buying in Westmount is not about chasing a discount; it is about securing a protected asset within a highly insulated commercial moat. As a fiduciary advisor, my mandate is to ensure you buy with absolute precision. We track the exact math across every asset class—from the high-yield density of Berkshire Village to the topographical scarcity of Rosecliffe—so you can act decisively and safely.

If you are serious about securing a property here, you cannot rely on the delayed, filtered data found on public portals. You need the complete picture.

The Strategic Choice:

To maximize your return in Westmount, your listing cannot afford to get lost in the shuffle. You require an advisor who tracks hyper-local market conditions daily and understands how to market your home’s specific proximity to the Wonderland Road commercial corridor.

To see exactly how your specific street is performing and to access hidden historical sold data that national portals are restricted from showing, access our fully vetted VOW (Virtual Office Website) portal.

Westmount, London, Ontario, Neighbourhood Page

Read

Westmount, London, Ontario Real Estate Market

The Westmount, London, Ontario, real estate market is ever-changing! It includes a combination of newer and older homes and condominiums, including townhouses, townhomes, and apartment buildings.

The Westmount London Neighbourhood Has Four Distinct Areas:

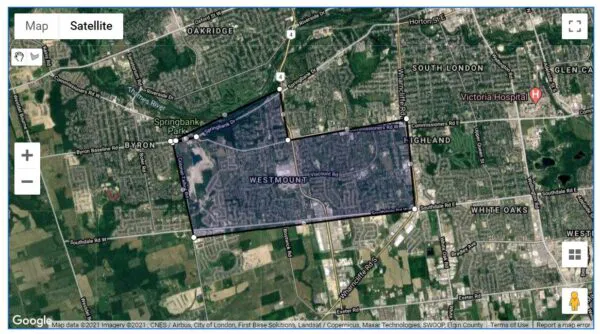
There are four MLS areas designated by the London St. Thomas Association of Realtors: South L, South M, South N, and South O. 

Extending Wonderland Road South to the 402 makes travelling west or east much easier and quicker. Beautiful Springbank Park features 19 miles of trails and picnic areas, including nearby Storybook Gardens.

Westmount Mall has evolved from a retail mall to a mixed-use medical/office and retail complex with a Cineplex theatre. Big-box stores, services, and restaurants are farther along Wonderland Road South. Along Southdale West, the Bostwick Community Centre, Library, and YMCA are open and expanding their services.

Here is What Is For Sale Now in Westmount London Ontario on MLS

Westmount London Ontario Real Estate Market in 2024

This is a historical snapshot — the Westmount, London, Ontario market in 2024. Markets move month to month. For current stats and my honest read on where each part of the city is actually heading, see my London neighbourhood market updates — ten neighbourhoods, refreshed monthly. Or for what your specific home is worth in today's market, reach out for a personal analysis. No pressure, no pitch.

Houses Sold in 2024 146Apartment Condos Sold in 2024 17Townhouses/Townhomes Sold in 2024 78
Time on Market 26 daysTime on Market 37 daysTime on Market 35 days
Price Range $440,000 – $1,460,000Price Range $240,000 – $584,900Price Range $305,000 – $980,000
% to Asking Price 98.82%% to Asking Price 96.47%% to Asking Price 98.71%

Westmount London Ontario Real Estate Market MLS Stats from The London St. Thomas Association of Realtors

Prior year’s sales history for Westmount London

another sold sign that Ty Lacroix has completed
Houses Sold in 2023 156Apartment Condos Sold in 2023 23Townhouses/Townhomes Sold in 2023 75
Time on Market 21 daysTime on Market 23 daysTime on Market 24 days
Price Range $430,000 – $2,075,000Price Range $280,000 – $727,980Price Range $350,000 – $750,000
% to Asking Price 100.31%% to Asking Price 98.88%% to Asking Price 98.31%

Westmount London Ontario Real Estate Market MLS Stats from The London St. Thomas Association of Realtors

2022

  • In 2022, 157 houses were sold in Westmount, London, with an average days-on-market of 16. The average sold price was 109.83% of the asking price. The sold prices for houses ranged from $380,000 to $1,575,000. 102 townhouse & townhome condos were sold within an average of sixteen days. Sold prices ranged from $325,000 to $838,000, averaging 110.29% of the asking price. Twenty-four apartment condos sold on an average of 17 days, and sold prices ranged from $224,000 to $566,000, 110.20% of the asking price!

2021

  • In 2021, 158 houses in Westmount, London, sold through MLS, averaging eight days on the market! Selling prices ranged from $495,000 to $1,170,007, 111.81% of the asking price. Thirty-two apartment condos in Westmount, London, were sold through MLS. These averaged eight days on the market and sold for 113.35% of the asking price. The lowest is $260,000; the highest is $661,000.  Fifty-seven townhouses or townhomes in the Westmount London area were sold. These averaged ten days on the market and sold for 113.70% of the asking price. The low is $350,000; the highest is $815,000.

2020

  •  In 2020, 138 houses changed hands, with the lowest at $356,000 and the highest at $1,066,000. The median selling price was 103.62% of the asking price, and listings averaged 16 days on the market. In Westmount, London, 84 apartment condos and townhouses changed hands. Prices ranged from $172,600 to $669,900, averaging 105.7% of the asking price, with only seven on the market. 

2019

  • In 2019, 139 houses were sold through the MLS in Westmount, London, Ontario, ranging from $340,000 to $1,299,900. These took 24 days to sell for 100.55% of the asking price. For townhouses and apartment condos, 97 changed hands. Prices ranged from $157,500 to $ 492,000, with a median of 104.83% of the asking price, sold in about fourteen days.

2018

  • In 2018, 168 houses were sold in the Westmount neighbourhood of London for an average price of $486,522. This was 102.38% of the asking price and took an average of nine days to change hands. In Westmount, London, Ontario, 84 condominiums were sold. Prices ranged from $ 110,000 to $473,900. Sixteen days on the market was the average to trade for 105.69% of the asking price!

Westmount, London, Ontario, Neighbourhood Map

Westmount London Map used by MLS

.Thames Valley District School Board

.London District Catholic School Board

Testimonial About What Our Clients Say About Envelope Real Estate Group

What our clients say about Ty Lacroix

Read
This website may only be used by consumers that have a bona fide interest in the purchase, sale, or lease of real estate of the type being offered via the website. The data relating to real estate on this website comes in part from the MLS® Reciprocity program of the PropTx MLS®. The data is deemed reliable but is not guaranteed to be accurate.