
The Westmount, London, Ontario, real estate market is ever-changing! It includes a combination of newer and older homes and condominiums, including townhouses, townhomes, and apartment buildings.
The Westmount London Neighbourhood Has Four Distinct Areas:
There are four MLS areas designated by the London St. Thomas Association of Realtors: South L, South M, South N, and South O.
Extending Wonderland Road South to the 402 makes travelling west or east much easier and quicker. Beautiful Springbank Park features 19 miles of trails and picnic areas, including nearby Storybook Gardens.
Westmount Mall has evolved from a retail mall to a mixed-use medical/office and retail complex with a Cineplex theatre. Big-box stores, services, and restaurants are farther along Wonderland Road South. Along Southdale West, the Bostwick Community Centre, Library, and YMCA are open and expanding their services.
Westmount London Ontario Real Estate Market in 2024
This is a historical snapshot — the Westmount, London, Ontario market in 2024. Markets move month to month. For current stats and my honest read on where each part of the city is actually heading, see my London neighbourhood market updates — ten neighbourhoods, refreshed monthly. Or for what your specific home is worth in today's market, reach out for a personal analysis. No pressure, no pitch.
Westmount London Ontario Real Estate Market MLS Stats from The London St. Thomas Association of Realtors
Prior year’s sales history for Westmount London
Westmount London Ontario Real Estate Market MLS Stats from The London St. Thomas Association of Realtors
2022
In 2022, 157 houses were sold in Westmount, London, with an average days-on-market of 16. The average sold price was 109.83% of the asking price. The sold prices for houses ranged from $380,000 to $1,575,000. 102 townhouses & townhome condos were sold within an average of sixteen days. Sold prices ranged from $325,000 to $838,000, with an average of 110.29% of the asking price. Twenty-four apartment condos sold on an average of 17 days, and sold prices ranged from $224,000 to $566,000, 110.20% of the asking price!
2021
In 2021, 158 houses in Westmount, London, sold through MLS, averaging eight days on the market! Selling prices ranged from $495,000 to $1,170,007, 111.81% of the asking price. 32 apartment-condos in Westmount, London, were sold through the MLS. These averaged eight days on the market and sold for 113.35% of the asking price. The lowest is $260,000; the highest is $661,000. Fifty-seven townhouses or townhomes in the Westmount London area were sold. These averaged ten days on the market and sold for 113.70% of the asking price. The low is $350,000; the highest is $815,000.
2020
In 2020, 138 houses changed hands, with the lowest at $356,000 and the highest at $1,066,000. The median selling price was 103.62% of the asking price, and listings averaged 16 days on the market. In Westmount, London, 84 apartment condos and townhouses changed hands. Prices ranged from $172,600 to $669,900, averaging 105.7% of the asking price, with only seven on the market.
2019
In 2019, 139 houses were sold through the MLS in Westmount, London, Ontario, ranging from $340,000 to $1,299,900. These took 24 days to sell for 100.55% of the asking price. For townhouses and apartment condos, 97 changed hands. Prices ranged from $157,500 to $492,000, with a median of 104.83% of the asking price, and homes sold in about 14 days.
2018
In 2018, 168 houses were sold in the Westmount neighbourhood of London for an average price of $486,522. This was 102.38% of the asking price and took an average of nine days to change hands. In Westmount, London, Ontario, 84 condominiums were sold. Prices ranged from $ 110,000 to $473,900. Sixteen days on the market was the average to trade for 105.69% of the asking price!
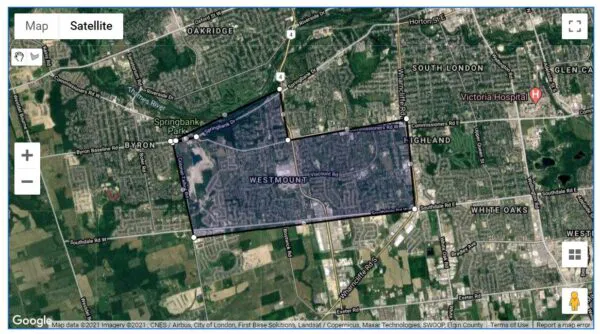
Westmount, London, Ontario, Neighbourhood Map
.Thames Valley District School Board
.London District Catholic School Board
Testimonial About What Our Clients Say About Envelope Real Estate Group

Also find me at tylacroix.com and Totally Preachless
