London Ontario Real Estate. No Fluff. No Sales Pitch. Just the Truth.

 Written by Ty Lacroix — Real Estate Strategist & Broker, London Ontario 

RSS

Old South London Ontario Real Estate

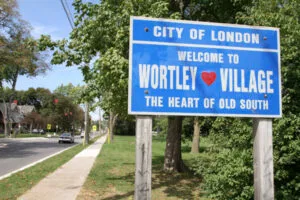
Welcome to the Old South, London, Ontario, real estate page, including Wortley Village.

Why Old South London and Wortley Village?

The character and charm of this great London neighbourhood is quite evident. Residents of Old South love the ability to walk and shop in the Wortley Village core—no wonder, with tree-lined streets and very few cookie-cutter homes.

There are more than 80 small businesses and establishments in Wortley Village, along with the Library and the YMCA.

Wortley Village BIA

The Old South Wortley Village Business Association does an excellent job hosting and presenting community events.

Here is what is for sale in Old South London on MLS

London South G map boundaries

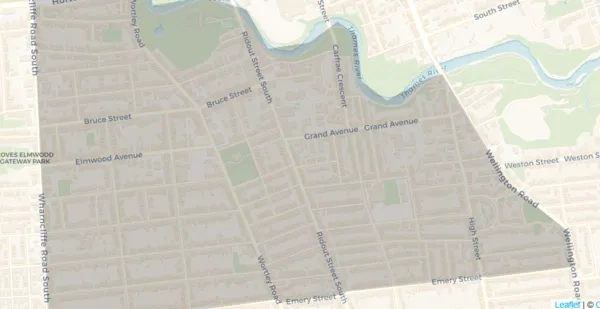
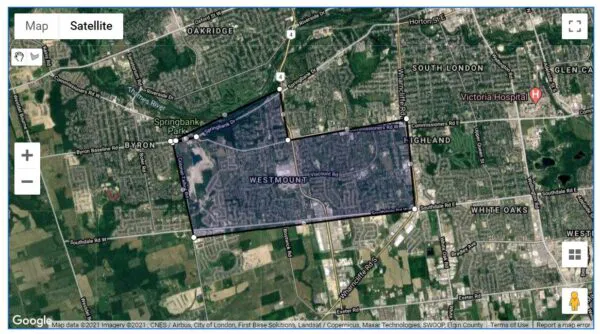
Our London, Ontario, St. Thomas Real Estate Association (LSTAR) uses the shaded area shown above, mapped as South F.

London South F map boundaries

This article covers historical real estate market conditions in Old South London and Wortley Village, London, Ontario, for the listed years. For current market insights, updated stats, or expert guidance, contact me for a personalized analysis.

What Sold in 2024 in Old South London & Wortley Village

SOLD history Old South London and Wortley Village
Houses Sold in 2024, 158Apartment Condos Sold in2024, 4Townhouses/Townhomes Sold in 2024 2
Time on Market 27 daysTime on Market 15 daysTime on Market 33 days
Price Range $260,000 – $1,500,000Price Range $477,000 -$1.070,,000Price Range $575,000-$750,000
% to Asking Price 99%% to Asking Price 101%% to Asking Price 100%

Old South London Area Data from MLS London St. Thomas Association of Realtors (LSTAR)

2023 Old South London Real Estate Market

Sold, a great 4 letter word
Houses Sold in 2023 150Apartment Condos Sold in 2023 5Townhouses/Townhomes Sold Year To Date 0
Time on Market 21 daysTime on Market 33 daysTime on Market N/A
Price Range $302,500 – $1,600,000Price Range $255,000 – $549,900Price Range N/A
% to Asking Price 100.78%% to Asking Price 99.47%% to Asking Price N/A

Old South London, Ontario Real Estate Data provided by MLS London St.Thomas Association of Realtors (LSTAR)

2022

  • In 2022, 168 houses in Old South London were sold, with an average of 15 days to sell. They sold for an average of 110.94% of the asking price, with prices ranging from $359,900 to $2,100,000. Nine apartment condos sold, and the average days on the market to sell through MLS was 23. The sold prices averaged 110.94% of the asking price, ranging from $500,000 to $1,200,000. Two townhouses sold, one at 30 Grand for $540,000 and one at 352 Ridout for $800,000.

2021

  • In 2021, 242 houses in Old South London, including Wortley Village, sold through MLS, averaging twelve days on the market. They sold for 111.03% of the asking price, with the lowest at $285,000 and the highest at $2,050,000. Thirteen apartment condos sold in Wortley Village in Old South London, averaging 15 days on the market and selling for 105.19% of the asking price. The lowest was $267,900; the highest was $772,811, and the average price per square foot was $408.00. Six townhouse condos sold, averaging seven days on the market and selling for 101.33% of the asking price—the lowest at $450,000 and the highest at $630,021.

2020

  •   In 2020, 186 homes sold, averaging 7 days to sell and selling for a median of 102.17% of the asking price, ranging from $246,000 to $1,500,000. Nine condos in Old South London changed hands in the same period. The median days to sell were 19, with 103.51% of the asking price, ranging from $139,000 to $472,000.

2019

  •   In 2019, 229 houses changed hands from $230,000 to $1,120,000. These took sixteen days to sell on MLS at a median of 103.13% of the asking price. Eight condominiums changed hands from a low of $152,100 to a high of $499,000. These averaged eight days on the market and sold for 101.22% of the asking price.      

2018

  • In 2018, real estate sales were robust in Wortley Village, Old South London, Ontario. One hundred ninety-six single-family houses sold for an average price of $404,718. 102.28% of the asking price, and the median time on the market was 20 days! 13 Wortley Village condominiums changed hands, averaging $309,902. These sold for 97.46% of the asking price; condos in Old South London took about 35 days to sell.

What our clients say

Schools:

 Thames Valley District School Board 

District Catholic School Board

Are You Curious About What Your Home Is Worth in Today’s Market?

Read

Westmount London Ontario Real Estate Market

The Westmount, London, Ontario, real estate market is ever-changing! It includes a combination of newer and older homes and condominiums, including townhouses, townhomes, and apartment buildings.

The Westmount London Neighbourhood Has Four Distinct Areas:

There are four MLS areas designated by the London St. Thomas Association of Realtors: South L, South M, South N, and South O. 

Extending Wonderland Road South to the 402 makes travelling west or east much easier and quicker. Beautiful Springbank Park features 19 miles of trails and picnic areas, including nearby Storybook Gardens.

Westmount Mall has evolved from a retail mall to a mixed-use medical/office and retail complex with a Cineplex theatre. Big box stores, services, and restaurants are further along Wonderland Road South. Along Southdale West, the Bostwick Community Centre, Library, and YMCA are open and expanding their services.

Here is What Is For Sale Now in Westmount London Ontario on MLS

Westmount London Ontario Real Estate Market in 2024

This article covers the historical real estate market conditions for Westmount London, Ontario, for 2024 and prior years. For current market insights, updated stats, or expert guidance, contact me for a personalized analysis.

A sold sign on a house in Westmount London
Houses Sold in 2024 146Apartment Condos Sold in 2024 17Townhouses/Townhomes Sold in 2024 78
Time on Market 26 daysTime on Market 37 daysTime on Market 35 days
Price Range $440,000 – $1,460,000Price Range $240,000 – $584,900Price Range $305,000 – $980,000
% to Asking Price 98.82%% to Asking Price 96.47%% to Asking Price 98.71%

Westmount London Ontario Real Estate Market MLS Stats from The London St. Thomas Association of Realtors

Prior year’s sales history for Westmount London

another sold sign that Ty Lacroix has completed
Houses Sold in 2023 156Apartment Condos Sold in 2023 23Townhouses/Townhomes Sold in 2023 75
Time on Market 21 daysTime on Market 23 daysTime on Market 24 days
Price Range $430,000 – $2,075,000Price Range $280,000 – $727,980Price Range $350,000 – $750,000
% to Asking Price 100.31%% to Asking Price 98.88%% to Asking Price 98.31%

Westmount London Ontario Real Estate Market MLS Stats from The London St. Thomas Association of Realtors

2022

  • In 2022, 157 houses were sold in Westmount, London, with an average days-on-market of 16. The average sold price was 109.83% of the asking price. The sold prices for houses ranged from $380,000 to $1,575,000. 102 townhouse & townhome condos were sold within an average of sixteen days. Sold prices ranged from $325,000 to $838,000, averaging 110.29% of the asking price. Twenty-four apartment condos sold on an average of 17 days, and sold prices ranged from $224,000 to $566,000, 110.20% of the asking price!

2021

  • In 2021, 158 houses in Westmount, London, sold through MLS, averaging eight days on the market! Selling prices ranged from $495,000 to $1,170,007, 111.81% of the asking price. Thirty-two apartment condos in Westmount, London, were sold through MLS. These averaged eight days on the market and sold for 113.35% of the asking price. The lowest is $260,000; the highest is $661,000.  Fifty-seven townhouses or townhomes in the Westmount London area were sold. These averaged ten days on the market and sold for 113.70% of the asking price. The low is $350,000; the highest is $815,000.

2020

  •  In 2020, 138 houses changed hands, with the lowest at $356,000 and the highest at $1,066,000. The median selling price was 103.62% of the asking price, and listings averaged 16 days on the market. In Westmount, London, 84 apartment condos and townhouses changed hands. Prices ranged from $172,600 to $669,900, averaging 105.7% of the asking price, with only seven on the market. 

2019

  • In 2019, 139 houses were sold through the MLS in Westmount, London, Ontario, ranging from $340,000 to $1,299,900. These took 24 days to sell for 100.55% of the asking price. For townhouses and apartment condos, 97 changed hands. Prices ranged from $157,500 to $ 492,000, with a median of 104.83% of the asking price, sold in about fourteen days.

2018

  • In 2018, 168 houses were sold in the Westmount neighbourhood of London for an average price of $486,522. This was 102.38% of the asking price and took an average of nine days to change hands. In Westmount, London, Ontario, 84 condominiums were sold. Prices ranged from $ 110,000 to $473,900. Sixteen days on the market was the average to trade for 105.69% of the asking price!

Westmount, London, Ontario, Neighbourhood Map

Westmount London Map used by MLS
schools in Westmount London

.Thames Valley District School Board

.London District Catholic School Board

Find out why these house sellers in Westmount London are pleased

Testimonial About What Our Clients Say About Envelope Real Estate Group

What our clients say about Ty Lacroix

Read
Categories:   18 Tecumseh Ave E London Ontario | Apartment condos London for sale | Byron London Onario Real Estate Market | Byron London Ontario | Byron London Ontario Trends | Condo Buyer Tips | Condo Seller Tips | Downsizing Your Home | Downtown London Ontario Condos For Sale | Exurban Living | Foxhollow London Ontario Real Estate Market | Home Buyer Tips & Ideas | Home Seller Tips | Homes For Sale Hyde Park London Ontario | Homes For Sale Sunningdale London | House For Sale Oakridge London Ontario | House With Granny Suiite | Houses for sale Foxhollow London | Hyde Park London Ontario Real Estate Market | Income Property London Ontario | Investing in Real Estate | Kilworth Real Estate Market | Komoka Real Estate Market | Lambeth London Ontario | Lambeth London Ontario Real Estate Market | Lambeth London Real Estate Trends | London North Real Estate | London Ontario Neighbourhoods | London Ontario Real Estate Market | London Ontario Real Estate Numbers That Matter | London Ontario Real Estate Trends | London Real Estate | London Realtor Differences | London South Real Estate | Market Math London Ontario | Oakridge London Ontario Real Estate Trends | Old South London | Old South London Wortley Village | One-Floor House For Sale | Penthouse For Sale London Ontario | Real Estate Conundrums | Real Estate Executor | Real Estate Trends | Real Estate Trends Hyde Park London Ontario | Riverbend London Ontario Real Estate | Riverbend London Real Estate Market | Riverbend London Real Estate Math | Selling in Riverbend London Ontario | Sunningdale London Ontario Real Estate Market | Sunningdale London Real Estate Market Trends | Why Buy or Sell Byron London Ontario | Wortley Village
This website may only be used by consumers that have a bona fide interest in the purchase, sale, or lease of real estate of the type being offered via the website. The data relating to real estate on this website comes in part from the MLS® Reciprocity program of the PropTx MLS®. The data is deemed reliable but is not guaranteed to be accurate.