

This is an opportune time to turn a London Ontario buyer’s market into an advantage, for both buyers and sellers!
Inventory Levels (homes for sale) in London, Ontario, for September reached their highest point in years, indicating a shift to a buyer’s market..
This article covers the historical London, Ontario, real estate market conditions for September 2025. For current market insights, updated stats, or expert guidance, contact me for a personalized analysis.

In September, 1,701 new listings were recorded via the MLS® System of the London and St. Thomas Association of REALTORS® (LSTAR), up 13.7% compared to the same month a year ago. With listings outpacing sales, the sales-to-new listings ratio also eased to 31.4%, compared to 45.7% in August.
A sales-to-new-listings ratio below 45% characterizes a buyer’s market. September 2025 saw six months of inventory, which is up from August, which recorded five months of inventory.”
Good For Serious Buyers
A buyer’s market in London, Ontario, means there are more listings, fewer competing offers, and sometimes a motivated seller means choice, leverage, and better pricing. Conditions return—financing, inspection, and, in some cases, the sale of your current home—so you can move with confidence. Without frantic bidding wars, you can tour carefully, compare neighbourhoods, and choose the home that truly fits—the Smartest Moves For Buyers.
Great For Wise Sellers
A buyer’s market in London, Ontario, doesn’t hand buyers the keys—it rewards disciplined sellers. The truth is, smart pricing, standout presentation, and tight terms shift leverage back to you. Fewer bidding wars, if any? Fine. Low-ball offers will happen; not to worry, nine out of ten times, lowball offers come from buyers who are not familiar with the market. You can list and sell with clarity, speed, and negotiation. The best part? You control the process—and protect your net. How to handle low-ball offers.
The table below shows the average prices for September 2025 and the MLS® HPI benchmark prices across LSTAR’s main regions.
The HPI benchmark price reflects the value of a “typical home” as assigned by buyers in a particular area based on various housing attributes. In contrast, the average sales price is calculated by summing the sale prices of all homes sold and dividing that total by the number of homes sold. The HPI benchmark price helps gauge trends over time, as averages may fluctuate due to changes in the mix of sales activity from one month to the next.
Home Prices Across Canada
The following table displays September’s benchmark prices for all housing types within LSTAR’s jurisdiction, showing how they compare with those recorded in the previous month and three months ago.
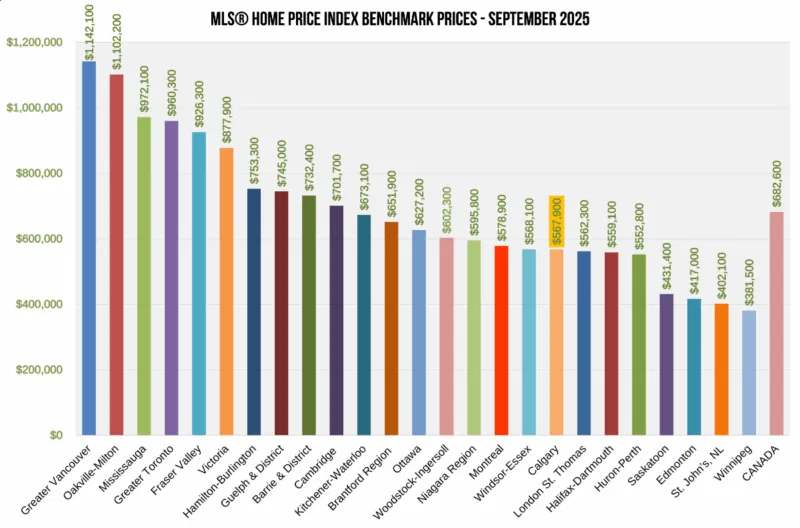
The chart below displays the most recent HPI benchmark prices nationwide, courtesy of CREA.
Comments:
Post Your Comment: