

This is a historical snapshot — London, Ontario for November 2024. Markets move month to month. For current stats and my honest read on where each part of the city is actually heading, see my London neighbourhood market updates — ten neighbourhoods, refreshed monthly. Or for what your specific home is worth in today's market, reach out for a personal analysis. No pressure, no pitch.
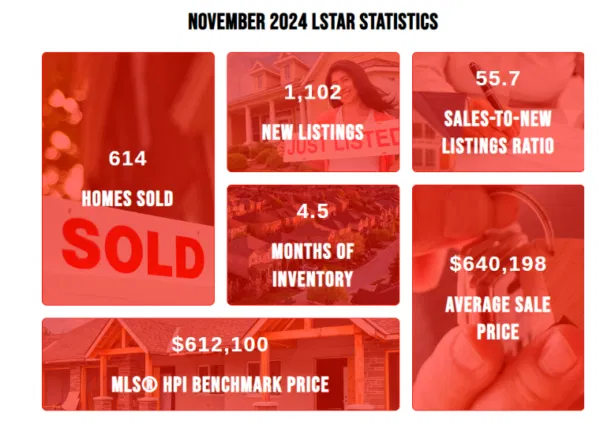
Six months of inventory is a buyer’s market, three months or less is a seller’s market, and London and the area have 4.5 months of inventory; predicting the market for the next few months is as foolish as trying to predict someone’s mood over the next few months.
The recent surge in the residential London, Ontario real estate market affects buyers and sellers differently. With more homes for sale, buyers have more choices, but the November market was a contradiction to that, with prices up, meaning home sellers must price their homes to today’s market and not two years ago’s.
In November, the average sale price in the real estate market was $640,198, reflecting a 5.9% increase compared to the same month last year. This rise in prices highlights the ongoing demand and value in the market. Sales activity also saw a significant boost, with 614 transactions, marking a 35.5% increase year-over-year. New listings saw a significant rise of 10.8% year-to-date, providing more options for buyers.
The table below displays November average prices and MLS® HPI Benchmark Prices in LSTAR’s main regions supplied by the Canadian Real Estate Association (CREA).
The HPI benchmark price reflects the value of a “typical home” as assigned by buyers in a particular area based on various housing attributes. In contrast, the average sales price is calculated by adding all the sale prices for homes sold and dividing that total by the number of homes sold. The HPI benchmark price is helpful to gauge trends over time since averages may fluctuate by changes in the mix of sales activity from one month to the next.
The following table displays November benchmark prices for all housing types within LSTAR’s jurisdiction and compares them with those recorded in the previous month and three months ago.
The real estate market in November showed several positive trends across different property types. The composite benchmark price reached $612,100, a steady 0.6% increase.
Single-family homes saw a notable rise to $663,100, up by 1.2%, while one-storey homes increased by 1.9% to $595,400.
Two-storey homes also experienced growth, with prices climbing by 0.8% to $718,300.
Townhouses maintained stability with a 1.0% increase, reaching $492,200.
At $373,700, the apartment market was down a bit.
The chart below shows the most recent HPI benchmark prices across Canada.
London and St. Thomas continue to offer exceptional value in the Canadian real estate market. With a benchmark price of $612,100, our region remains one of the most affordable major centers.

Comments:
Post Your Comment: