
What a great time for home buyers in London, Ontario, and the surrounding area. With a 15.3% increase in new listings, active listings increased 26.5% in May!
I say this because prices rose in May by 1.4%, which is less than the inflation rate.
We have all read about people buying when everyone else is selling and selling when everyone else is buying. When the stock market plunged, smart money bought or averaged out their investments.
Some will say it takes nerves to do that, it is risky, what if prices go down, interest rates go up, it will be too warm tomorrow or it might rain, or, worst of all, not everybody is doing that so I will stick with the herd, but not try to look and behave with the sheep!
The May 2025 London Ontario & Surrounding Area Real Estate Market
The table below displays May’s average prices and MLS® HPI Benchmark Prices in LSTAR’s (London St. Thomas Association of Realtors) main regions.
The HPI benchmark price reflects the value of a “typical home” by buyers in a particular area based on various housing attributes. In contrast, the average sales price is calculated by adding all the sale prices for homes sold. Dividing that total by the number of homes sold. The HPI benchmark price is helpful in gauging trends over time, as averages may fluctuate due to changes in the mix of sales activity from one month to the next.
In May 2025, the MLS® Home Price Index Benchmark Price for the London and St. Thomas area showed varied trends. The composite benchmark price was $593,900. Reflecting a slight increase of 0.8% from the previous month. A decrease of 4.5% over three months and 2.2% over twelve months.
Single-family homes had a benchmark price of $651,500, representing a 1.6% increase from last month. A 13.6% decline over the past three years!
One-storey homes saw the most significant monthly increase at 3.5%, reaching $602,700. Two-storey homes had a modest 0.6% rise to $691,700.
If You Are Thinking of Buying, This is a Great Time
Townhouses and apartments experienced declines. The benchmark prices of $488,200 and $369,500, respectively, indicate a challenging market for these property types.
Over the past five years, one-storey homes have shown the highest growth rate at 55.9%, highlighting long-term appreciation in this segment.
The following table displays May’s benchmark prices for all housing types within LSTAR’s jurisdiction. Showing how they compare with those recorded in the previous month and three months ago.
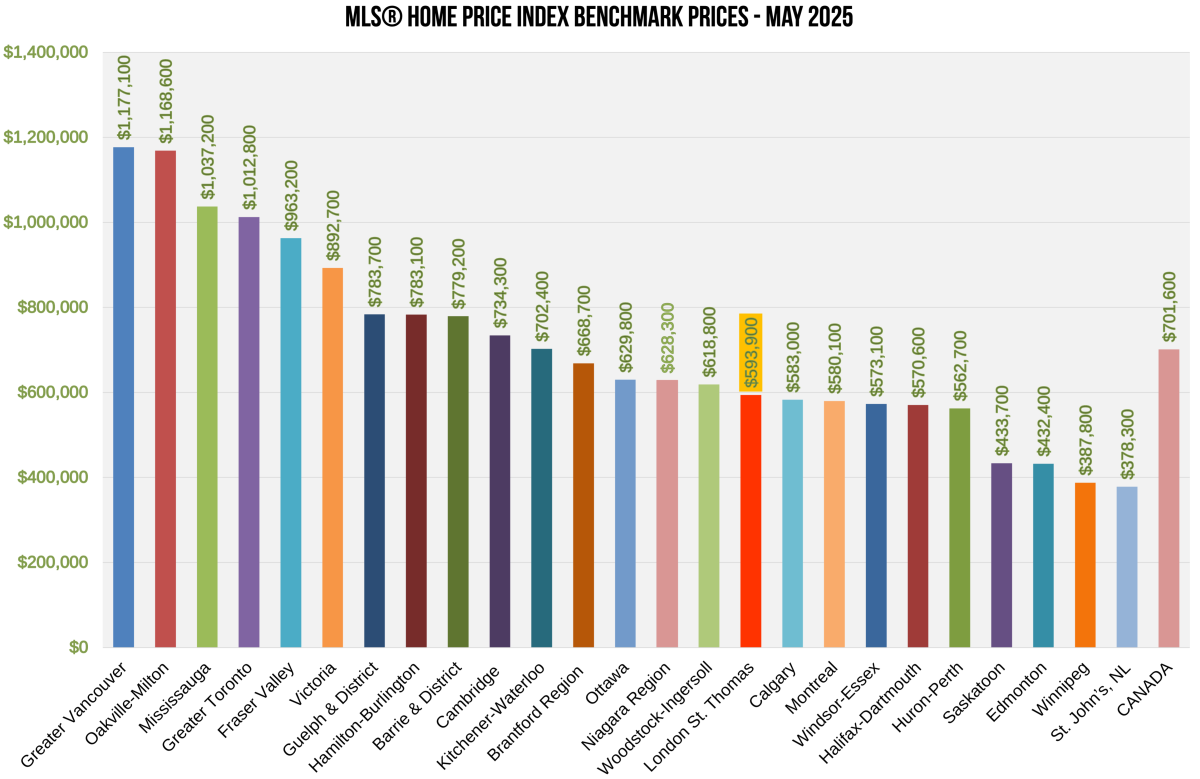
The chart below shows the most recent HPI benchmark prices across Canada.

In summary, what to do? To Sherlock Holmes: “The world is full of obvious things which nobody by any chance observes”!
Written by Ty Lacroix Broker