
London Ontario Real Estate. No Fluff. No Sales Pitch. Just the Truth.

 Written by Ty Lacroix — Real Estate Strategist & Broker, London Ontario 

RSS

What A Great Time For Home Buyers in London Ontario!

This is a historical snapshot — London, Ontario, for May 2025. Markets move month to month. For current stats and my honest read on where each part of the city is actually heading, see my London neighbourhood market updates — ten neighbourhoods, refreshed monthly. Or for what your specific home is worth in today's market, reach out for a personal analysis. No pressure, no pitch.

What a great time for home buyers in London, Ontario, and the surrounding area. With a 15.3% increase in new listings, active listings increased 26.5% in May!

I say this because prices rose by 1.4% in May, which is below the inflation rate.

We have all read about people buying when everyone else is selling and selling when everyone else is buying. When the stock market plunged, smart money bought or averaged out their investments.

Some will say it takes nerves to do that; it is risky. What if prices go down, interest rates go up, it will be too warm tomorrow, or it might rain, or, worst of all, not everybody is doing that, so I will stick with the herd, but not try to look and behave like the sheep!

The May 2025 London, Ontario & Surrounding Area Real Estate Market

The table below displays May’s average prices and MLS® HPI Benchmark Prices in LSTAR’s (London St. Thomas Association of Realtors) central regions.

AreaMay 2025
MLS® HPI Benchmark Price
May 2025
Average Price
Central Elgin$638,900$689,474
London East$468,400$524,701
London North$682,000$742,398
London South$589,700$649,905
Middlesex Centre$843,600$979,397
St. Thomas$545,700$564,737
Strathroy-Caradoc$823,100$679,453
LSTAR$593,900$656,432

The HPI benchmark price reflects the value of a “typical home” for buyers in a given area, based on various housing attributes. In contrast, the average sales price is calculated by summing the sale prices of all homes sold. Dividing that total by the number of homes sold. The HPI benchmark price helps gauge trends over time, as averages may fluctuate due to changes in the mix of sales activity from month to month.

In May 2025, the MLS® Home Price Index Benchmark Price for the London and St. Thomas area showed varied trends. The composite benchmark price was $593,900. Reflecting a slight increase of 0.8% from the previous month. A decrease of 4.5% over three months and 2.2% over twelve months.

Single-family homes had a benchmark price of $651,500, up 1.6% from last month. A 13.6% decline over the past three years!

One-storey homes saw the most significant monthly increase, up 3.5% to $602,700. Two-storey homes rose modestly by 0.6% to $691,700.

If You Are Thinking of Buying, This is a Great Time

Townhouses and apartments experienced declines. The benchmark prices of $488,200 and $369,500, respectively, indicate a challenging market for these property types.

Over the past five years, one-storey homes have grown the fastest, up 55.9%, highlighting long-term appreciation in this segment.

The following table displays May’s benchmark prices for all housing types within LSTAR’s jurisdiction. Showing how they compare with those recorded in the previous month and three months ago.

MLS® Home Price Index Benchmark Prices
Benchmark TypeMay 2025Change Over 
April 2025
Change Over
February 2025
LSTAR Composite$593,900↑0.8%↓4.5%
LSTAR Single-Family$651,500↑1.6%↓3.3%
LSTAR One Storey$602,700↑3.54%↓0.9%
LSTAR Two Storey$691,700↑0.6%↓5.0%
LSTAR Townhouse$488,200↓0.4%↓1.8%
LSTAR Apartment$369,500↓6.2%↓2.7%

In summary, what to do? To Sherlock Holmes: “The world is full of obvious things which nobody by any chance observes”!

What Prudent Home Buyers Do

Also find me at tylacroix.com and Totally Preachless

Read

Not All Homes in London Ontario Are Overpriced!

In a buyer's market, many buyers and their agents use a blanket low-offer strategy regardless of a home's actual value — and it's costing them. Not every home in London, Ontario is overpriced. Some are genuinely well-priced, upgraded, and sitting on the market simply because buyers are comparing them to inferior sales from months earlier rather than properly reading the current comparable data. A real example: a buyer who refused to pay $650,000 for a superior townhouse ended up paying $595,000 two weeks later for an older, lesser unit with $285 higher monthly condo fees. The market offers real opportunity right now — but only to buyers who can tell the difference between an overpriced home and one that's genuinely worth what it's asking. Ty Lacroix, Broker at The Envelope Real Estate Group, has spent 24 years helping London buyers find that difference before it costs them.

Not all homes in London, Ontario are overpriced. Yes, we're in a buyer's market — but that doesn't mean every seller will or should reduce their price, and treating the market as if they all should is costing buyers real money.

Some sellers have genuinely overpriced their homes. That's true. But comparing those listings to ones that are priced correctly, and applying the same low-offer logic to both, is what economists might call throwing the baby out with the bathwater — and it's distorting buyer decision-making in a way that consistently leads to worse outcomes for buyers themselves.

Here's a concrete example.

A Tale of Two Units

A townhouse condo is listed for sale at $650,000. It's the only available unit in its enclave. Five months earlier, one sold in the same complex for $565,000.

The immediate reaction from most buyers and their agents is that the $650,000 unit is overpriced.

Before accepting that conclusion, I looked at what the $565,000 sale actually was:

The seller was in financial difficulty and needed to sell quickly or risk losing the property to the mortgage holder. The listing had nine photos, no video, and no floor plans. No status certificate was provided — the buyer was responsible for ordering one themselves. It had been listed at $639,000 originally, cancelled, reduced, and expired three times before finally selling. Everything inside was original from the builder with no upgrades. The listing agent was based in the GTA, and the only way to book a showing was through a brokerage switchboard — usually an answering service — then waiting hours for a callback, sometimes days by email. The unit was vacant and dusty, with a stale odour. The rugs were slightly soiled and the walls needed paint.

Now the $650,000 unit:

Upgraded throughout — high-quality flooring, lighting, window coverings, and appliances, professionally decorated. One additional bathroom. A backyard view of green space rather than a six-foot concrete wall.

Other units that sold in that enclave through 2024 ranged from $619,000 to $640,000. The $650,000 unit, with its extra bathroom and full upgrades, was priced at a premium over that range — but a defensible one when the comparables were read properly.

What Actually Happened

A buyer viewed the $650,000 unit, appreciated it, but concluded it was overpriced because a unit there had sold five months earlier for $565,000. An offer of $575,000 was made and refused — the seller and their agent considered it insulting given the unit's condition and upgrades. A verbal counter of $589,000 was declined.

Two weeks later, that same buyer purchased a unit in a different part of London for $595,000. It was older, in lesser condition, and carried monthly condo fees $285 higher than the unit they'd walked away from.

Who came out ahead?

The buyer paid more per month, got less quality, and walked away from a genuinely superior asset because they applied a blanket low-offer strategy without reading what actually drove the earlier $565,000 sale. The "overpriced" unit wasn't overpriced. It was correctly priced for what it was — and the buyer who understood that would have gotten the better home at a comparable net cost.

What This Means Right Now

The current London market is a genuine opportunity for buyers. There is real softening, and there are homes that are genuinely overpriced. Those sellers, if they're serious about selling, will eventually have to adjust.

But there are also sellers whose homes are priced accurately, who are not in a hurry, and who have no reason to negotiate below market value just because the broader market has softened. Those sellers will wait for the buyer who does their homework. And they'll find that buyer — while the buyers playing a blanket low-offer game miss the value that was right in front of them.

I see well-priced homes and condos sitting on the market regularly, waiting for the buyer with enough market knowledge to recognize value when it's there. If you want to be that buyer — the one who identifies real opportunity instead of chasing inferior alternatives at a comparable price — that's exactly the kind of guidance worth having before you write your next offer.

Oh, by the way, I sold that $650,000 unit for $649,000!


Want to know the difference between a home that's overpriced and one that's genuinely worth it? Reach out for a private conversation — no pressure, no pitch.

Also find me at tylacroix.com and Totally Preachless

Read

Can You Time The Real Estate Market in London Ontario

Timing the real estate market in London, Ontario is a guessing game. Anyone who tells you otherwise is guessing too — they just sound more confident about it. The market doesn't care when you want to buy or sell. It moves according to forces that have nothing to do with your timeline, preferences, or plan. What you can control is your preparation, your mindset, and your decision to act when your circumstances call for it — not when the headlines say it's the right moment. Ty Lacroix, Broker at The Envelope Real Estate Group, has spent 24 years watching buyers and sellers wait for the perfect moment that never quite arrives.

The market doesn't care when you want to move. It doesn't adjust to your preferred timeline, your financial situation, or your comfort level. Quality, well-located homes end up sitting on the market longer than they should, or unsold entirely, not because the market is broken but because the seller's expectations didn't align with what the market was actually willing to pay at that moment.

Here's the most important thing to understand: you are the market. You, and five or fifty or five hundred other buyers and sellers making decisions at roughly the same time, each acting on their own situation, their own emotions, and their own financial position. Nobody controls the market. The market is just the aggregate of all those individual decisions happening at once.

Three Examples of What You Can't Control

The Florida snowbird. You've decided to sell your place in Florida. So have ten of your neighbours. You cannot control their motivation, their urgency, or what price they're willing to accept. Their decisions will affect yours whether you like it or not. What you can control is your own commitment to the outcome — and whether you're genuinely ready to pay the price the market sets, not the one you'd prefer.

The competing listing. You've listed your condo at a price you believe is fully justified by the comparables. A week later, another unit in the same building lists for 15% higher — or lower. You didn't see it coming. You can't undo it. What you can control is how quickly you read the new information and whether you adapt your strategy or dig in stubbornly.

The interest rate merry-go-round. When rates were below 2%, you waited — surely they'd go lower. When they hit 4.5%, you waited again — surely they'd come down. Meanwhile, the right home passed by twice. Merry-go-rounds are for children. At some point the waiting itself becomes the most expensive decision you've made, because the opportunity cost of time is real and it compounds quietly.

What You Can Actually Control

I'm a broker, not an economist, and timing the market is not something I can do. If I give you an opinion about where the market is heading, that opinion is, in reality, a guess dressed up in experience. What I can control — and what any good broker should be focused on — is work ethic, local knowledge, honest advice, and the patience to stay the course when the market doesn't cooperate with anyone's preferred timeline.

The clients who consistently make good real estate decisions aren't the ones who called the market correctly. They're the ones who understood their own situation clearly, made a decision based on their real circumstances, and acted on it without waiting for a certainty that would never arrive.


Ready to make a decision based on your situation rather than the headlines? Reach out for a private conversation — no pressure, no pitch.

Also find me at tylacroix.com and Totally Preachless

Read

Where is The London, Ontario Real Estate Market Heading

This is a historical snapshot — London, Ontario, for April 2025. Markets move month to month. For current stats and my honest read on where each part of the city is actually heading, see my London neighbourhood market updates — ten neighbourhoods, refreshed monthly. Or for what your specific home is worth in today's market, reach out for a personal analysis. No pressure, no pitch.

There are many opinions on where the London, Ontario, real estate market is heading. There are the pessimists and the optimists, the fearmongers, the “the sky is falling” crowd, and the “I don’t care” crowd!

I have included below a few facts (the truth) about the London and area market as of April 30. Briefly explain the facts and how to respond to them. Predictions are for those with nothing valid to say; hence, verbal diarrhea.

If you want to know where the London, Ontario, real estate market is headed and what you can do today to stay ahead, contact me.

Average home price

  • North London: $724,739

  • South London: $684,335

  • East London: $514,004

  • St. Thomas: $574,887

  • Central Elgin: $641,445

  • Strathroy-Caradoc: $682.149

April 2025

  • Sales: 653, down 14.3% from 2024

  • Dollar amount: $427 million, down 14.8%

  • New listings: 1,523, down 10.1% 

  • Active listings: 2,891, up 19.6%

  • Average price: $654,147, down 0.5% 

  • Months of Inventory: 4.4, up from 3.2

  • Days on the market: 21, up from 16

Year-to-date 2025

  • Sales: 2,107, down 19.2% from 2024

  • Dollar amount: $1.3 billion, down 18.4%

  • New listings: 5,190, up 1.5%

  • Active listings: 2,417. up 22.5%

  • Average price: $645,593, up 1.1%

  • Months of inventory: 4.6, up from 3.0

  • Days on Market: 24, up from 18

The table below displays April’s benchmark prices for all housing types within LSTAR’s jurisdiction and compares them with those recorded in the previous month and three months ago.

MLS® Home Price Index Benchmark Prices
Benchmark TypeApril 2025Change Over 
March 2025
Change Over
January 2025
LSTAR Composite$589,200↓4.1%↓4.6%
LSTAR Single-Family$641,100↓3.8%↓3.6%
LSTAR One Storey$583,300↓4.9%↓2.5%
LSTAR Two Storey$688,600↓3.1%↓4.4%
LSTAR Townhouse$489,1000.0%↓0.6%
LSTAR Apartment$393,800↑4.0%↓4.2%

Meaning?

For Sellers:

  • With 2,891 properties for sale, buyers have choices. Most can read, listen to, or watch the news and feel they have an advantage in the price they are willing to pay.

  • It behooves a home seller to understand that other homes compete with yours. You may feel your place is a castle, but buyers won’t.

  • Buyers know prices. They view 6-10 homes; price, condition, and location matter.

  • There are buyers out there; attract the right buyer. How? My home seller guide has quite a few tips and ideas.

For Buyers:

  • Know what is available and what you can expect within your budget.

  • Fully understand that over 60% of homes listed for sale are priced right, and the only loser in lowballing a seller is you.

  • Yes, there will be sellers who must sell, but they are in the minority.

  • Remember, you are buying a home, a place you can come home to and live in; real estate property is not a commodity. A few home buyer ideas in this market.

Also find me at tylacroix.com and Totally Preachless

Read

Will This London Ontario Real Estate Market Surge Affect You?

This is a historical snapshot — London, Ontario for November 2024. Markets move month to month. For current stats and my honest read on where each part of the city is actually heading, see my London neighbourhood market updates — ten neighbourhoods, refreshed monthly. Or for what your specific home is worth in today's market, reach out for a personal analysis. No pressure, no pitch.

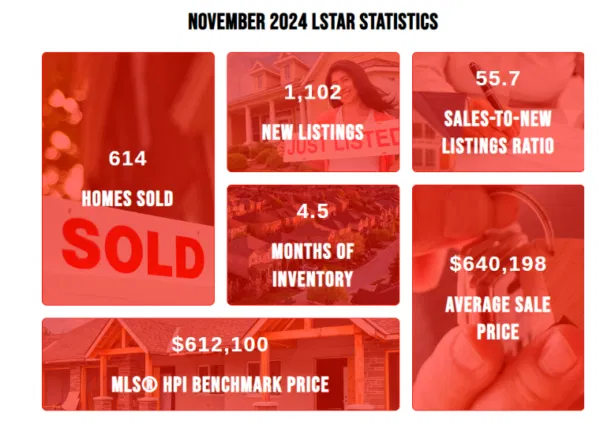
Six months of inventory is a buyer’s market, three months or less is a seller’s market, and London and the area have 4.5 months of inventory; predicting the market for the next few months is as foolish as trying to predict someone’s mood over the next few months.

The recent surge in the residential London, Ontario real estate market affects buyers and sellers differently. With more homes for sale, buyers have more choices, but the November market was a contradiction to that, with prices up, meaning home sellers must price their homes to today’s market and not two years ago’s.

In November, the average sale price in the real estate market was $640,198, reflecting a 5.9% increase compared to the same month last year. This rise in prices highlights ongoing demand and market value. Sales activity also saw a significant boost, with 614 transactions, representing a 35.5% year-over-year increase. New listings rose 10.8% year-to-date, providing more options for buyers.

The table below displays average November prices and MLS® HPI Benchmark Prices for LSTAR’s main regions, as supplied by the Canadian Real Estate Association (CREA).

AreaNovember 2024 MLS®
HPI Benchmark Price
November 2024
Average Price
Central Elgin$641,900$797,850
London East$485,500$515,978
London North$714,300$684,820
London South$613,500$639,990
Middlesex Centre$878,000$1,131,763
St. Thomas$557,100$565,269
Strathroy-Caradoc$804,800$639,863
LSTAR$612,100$640,198

The HPI benchmark price reflects the value of a “typical home” in a particular area, as determined by buyers based on various housing attributes. In contrast, the average sales price is calculated by adding all the sale prices for homes sold and dividing that total by the number of homes sold. The HPI benchmark price is helpful for gauging trends over time, since averages may fluctuate due to changes in the mix of sales activity from one month to the next.

The following table displays November benchmark prices for all housing types within LSTAR’s jurisdiction and compares them with those recorded in the previous month and three months ago.

MLS® Home Price Index Benchmark Prices
Benchmark TypeNovember 2024Change Over 
October 2024
Change Over
August 2024
LSTAR Composite$612,100↑0.6%↓1.8%
LSTAR Single-Family$636,100↑1.2%↓0.9%
LSTAR One Storey$595,400↑1.9%↑0.2%
LSTAR Two Storey$718,300↑0.8%↓1.3%
LSTAR Townhouse$492,200↑1.0%↓3.5%
LSTAR Apartment$373,700↓9.4%↓12.6%

The real estate market in November showed several positive trends across different property types. The composite benchmark price reached $612,100, a steady 0.6% increase.

  • Single-family homes saw a notable rise to $663,100, up by 1.2%, while one-storey homes increased by 1.9% to $595,400.

  • Two-storey homes also experienced growth, with prices climbing by 0.8% to $718,300.

  • Townhouses maintained stability, with a 1.0% increase to $492,200.

  • At $373,700, the apartment market was down a bit.

The chart below shows the most recent HPI benchmark prices across Canada.

London and St. Thomas continue to offer exceptional value in the Canadian real estate market. With a benchmark price of $612,100, our region remains one of the most affordable major centres.

Also find me at tylacroix.com and Totally Preachless
Read
This website may only be used by consumers that have a bona fide interest in the purchase, sale, or lease of real estate of the type being offered via the website. The data relating to real estate on this website comes in part from the MLS® Reciprocity program of the PropTx MLS®. The data is deemed reliable but is not guaranteed to be accurate.