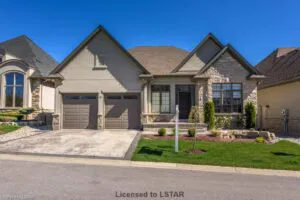
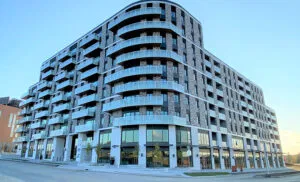
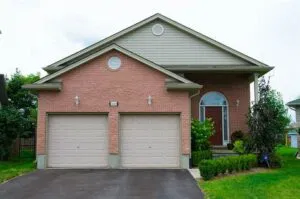
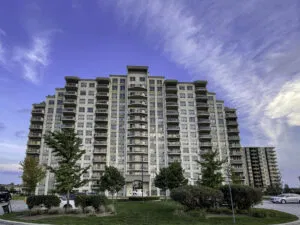
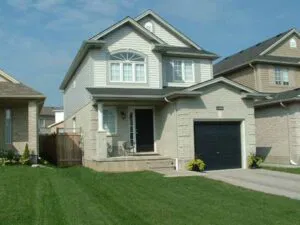
The Riverbend London, Ontario, real estate market has changed considerably over the last few years with many options. The availability of apartment buildings, townhouses, and single-family homes has grown, as has the West 5 development.
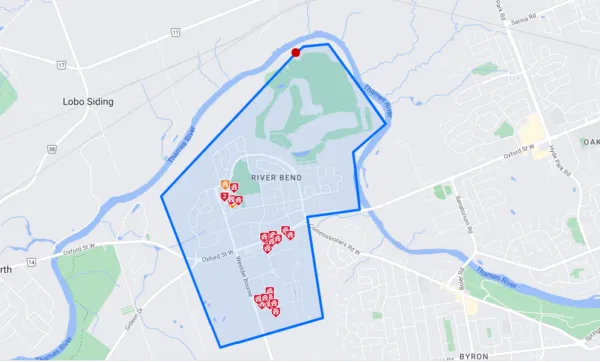
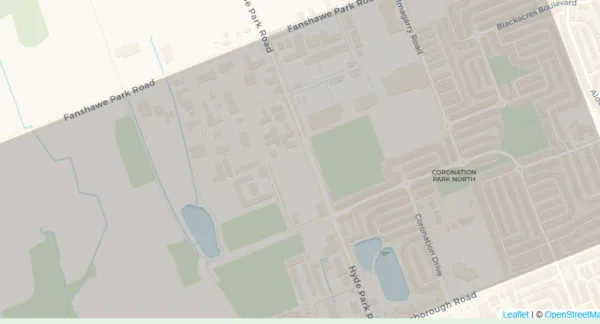
Riverbend London, Ontario, is a neighbourhood in the southwest part of London; take Oxford Street West to Kains Road. The growth of retail, services and offices along Oxford West is fast-paced and offers the residents nearby the most amenities one would need!
The gated Riverbend Golf Community is attractive and offers its members security, clubhouse facilities and dining. The Riverbend area is 11 minutes or less from downtown London. There are great nature trails, bike paths, golfing, or just not doing anything; you will enjoy the quiet. Five golf courses are within 4 km.
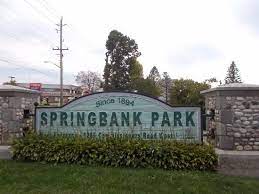
The walking trail along the Thames River (Kains Woods -Upper Thames River Conservation) is a gem for nature lovers. Nearby are the Warbler Woods Conservation Area and Komoka Provincial Park.
Riverbend Park is in the heart of the neighbourhood and has ample green space, play structures and soccer fields.
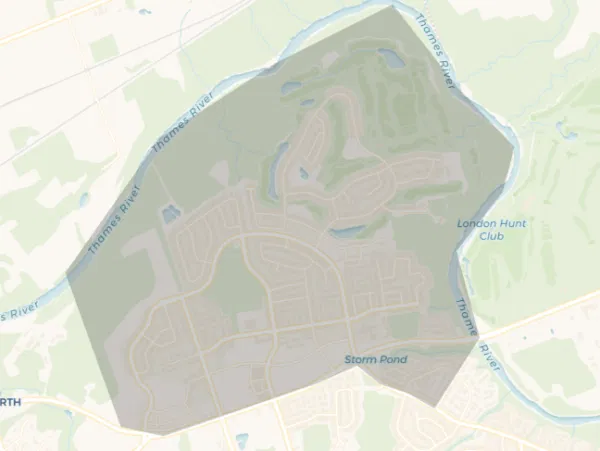
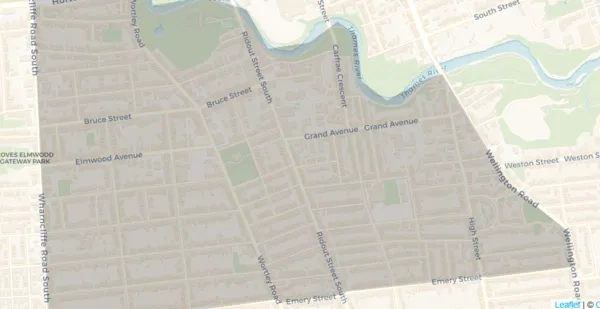
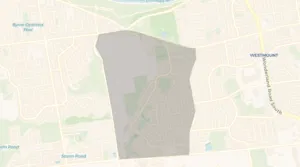
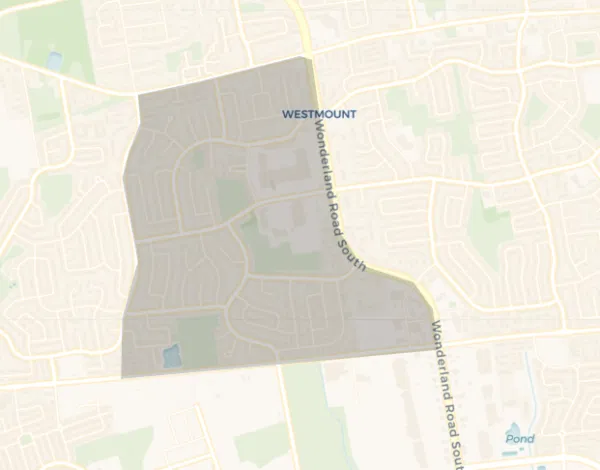
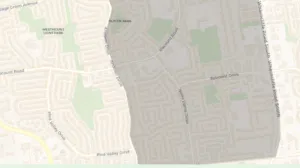
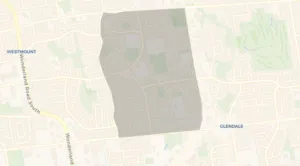
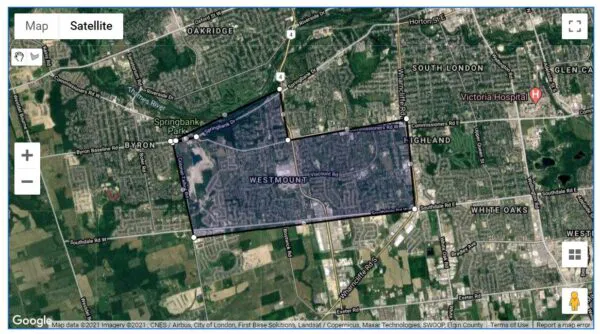
Our London Ontario St.Thomas Real Estate Association (LSTAR) uses the above-shaded area, which is mapped as South A. Explore South A now and see the recent demographics, incomes, age groups and what you may want to know or not know!
Homes Sold in The Riverbend London Ontario Area in 2024
| Houses Sold in 2024 42 | Townhouses/Townhomes Sold Year to Date in 2024 12 |
| Time on Market 65 days | Time on Market 36 days |
| Price Range $650,000 – $1,730,000 | Price Range $657,500 -$815,000 |
| % to Asking Price 98.44% | % to Asking Price 98.20% |
Riverbend London Ontario Real Estate Market Area Data as per MLS London St.Thomas Association of Realtors (LSTAR)
Previous Years’ Sales in The Riverbend London Area
| Houses Sold in 2023 51 | Townhouses/Townhomes Sold Year in 2023 39 |
| Time on Market 36 days | Time on Market 26 days |
| Price Range $701,000 – $2,025,000 | Price Range $510,000 – $910,000 |
| % to Asking Price 97.13% | % to Asking Price 99.10% |
Riverbend London Ontario Real Estate Market Area Data as per MLS London St.Thomas Association of Realtors (LSTAR)
2022
In 2022, 55 houses in Riverbend London sold with prices ranging from $740,000 to $1,695,000. This was 101.16% of the asking price, and these took an average of twenty-three days on the market to sell. Five apartment condos at 2050 Linkway were sold through MLS. Averaging $512.00 per square foot, with prices ranging from $806,000 to $907,000. Thirty townhouses & townhomes in Riverbend London sold with prices ranging from $635,000 to $1,075,000. This was 109.26% of the asking price, and these thirty averaged 23 days on the market to sell.
2021
In 2021, 58 houses were sold in the Riverbend neighbourhood of London. Averaging 23 days to sell for 107% of the asking price. The final sale prices ranged from $675,000 to $1,790,000. Twenty-eight townhomes sold for 113.17% of the asking price. These took, on average, nine days to sell and sold at prices ranging from $565,000 to $820,000. Eleven apartment condos sold at 2050 Linkway, averaging $453.00 per square foot, sold prices ranging from $594,000 to $881,000.
2020
In 2020, 65 houses in the Riverbend neighbourhood in West London sold through MLS for 99.92% of the asking price. The lowest being $503,000 and the highest being $2,650,000. For townhouses & townhomes in Riverbend, 22 changed hands, from a low of $449,900 to $520,532. This was 100.07% of the asking price and averaged 15 days on the market.
2019
In 2019, our MLS system sold 77 homes in the Riverbend London neighbourhood. The prices ranged from $399,000 to $1,070.000, and they averaged 34 days on the market. The median selling price was 99.91% of the asking price.
2018
In 2018, 82 homes were sold through our local MLS in the Riverbend neighbourhood in London, Ontario. The average selling price was $681,665. This was 99.62% of the asking price. The median days to sell were 40. The lowest price was $366,697, and the highest was $1,500,000.
Why Children Like The Gated Riverbend Golf Community in London, Ontario
We always used to spend the holidays with Grandma and Grandpa. They used to live in a big brick house, but Grandpa got retarded, and they moved to the Riverbend Golf Community, where everyone lives in beautiful little homes, so they don’t have to mow the grass anymore!
They ride around on their bicycles and scooters and wear name tags because they don’t know who they are anymore. They go to a wreck centre building, but they must have fixed it because it is okay now.
They do exercises there, but they don’t do them very well. There is a swimming pool, but they all jump up and down in it with hats. At their gate, there is a dollhouse with a little old man sitting in it.
He watches all day so nobody can escape. Sometimes they sneak out and go cruising in their golf carts!
Nobody there cooks; they eat out. And, they eat the same thing every night — early birds.
Some of the people can’t get out past the man in the dollhouse. The ones who do get out bring food back to the wrecked centre for a potluck.
My Grandma says that Grandpa worked all his life to earn his retardment and thinks I should work hard so I can be retarded someday too.
When I earn my retardment, I want to be the man in the dollhouse. Then I will let people out, so they can visit their grandchildren.